VisionX 420D Review: ASRock's mini-PC Lineup Continues to Impress
by Ganesh T S on September 1, 2014 9:00 AM ESTPerformance Metrics - I
The VisionX 420D was evaluated using our standard test suite for low power desktops / industrial PCs. We revamped our benchmark suite earlier this year after the publication of the Intel D54250WYK NUC review) We reran some of the new benchmarks on the older PCs also, but some of them couldn't be run on loaner samples. Therefore, the list of PCs in each graph might not be the same.
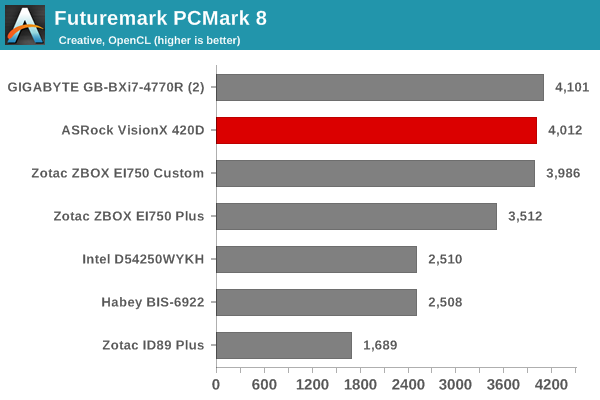
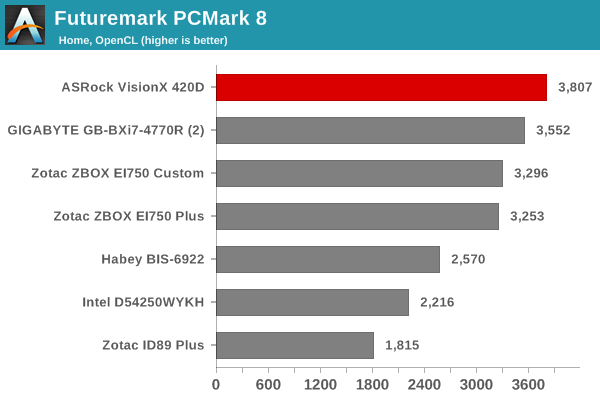
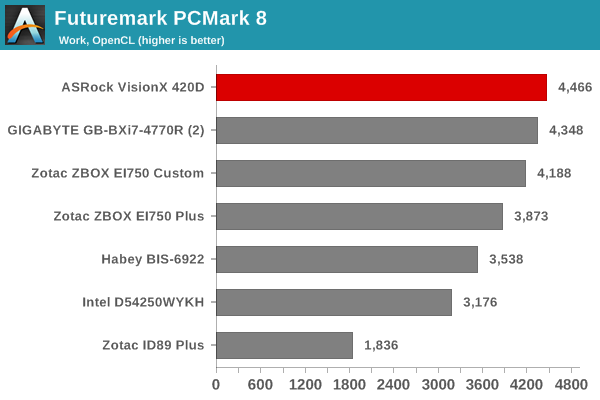
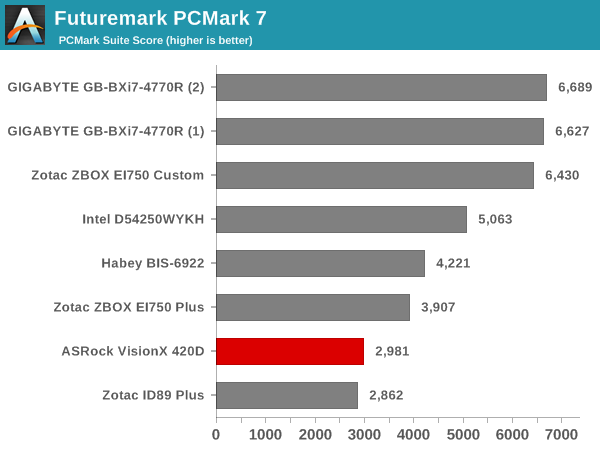
Futuremark PCMark 8
PCMark 8 provides various usage scenarios (home, creative and work) and offers ways to benchmark both baseline (CPU-only) as well as OpenCL accelerated (CPU + GPU) performance. We benchmarked select PCs for the OpenCL accelerated performance in all three usage scenarios.
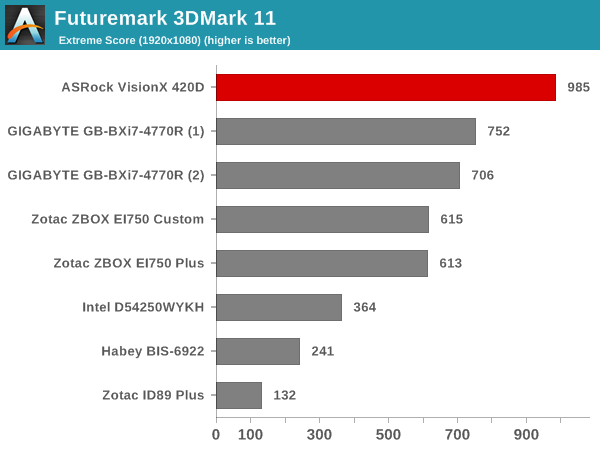
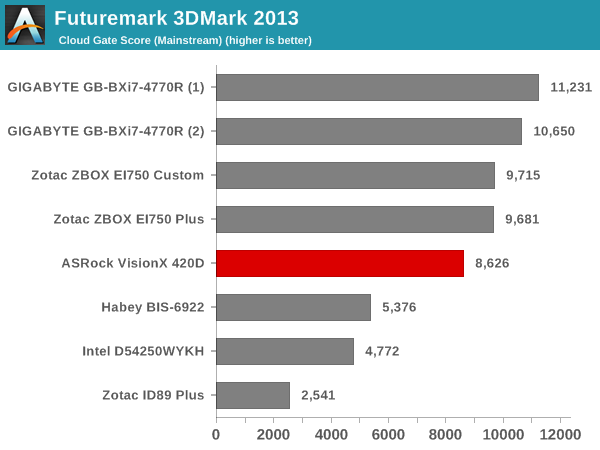
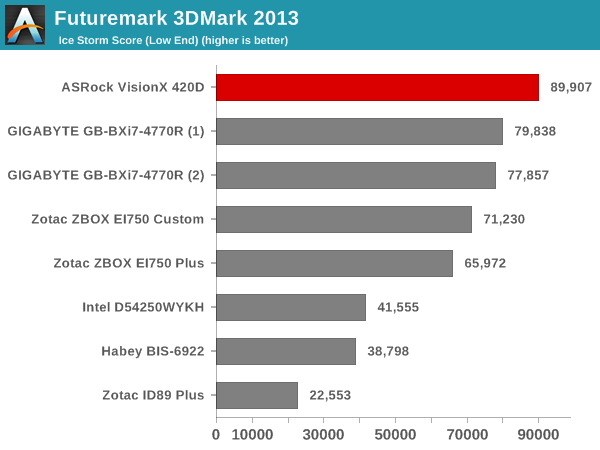
Miscellaneous Futuremark Benchmarks
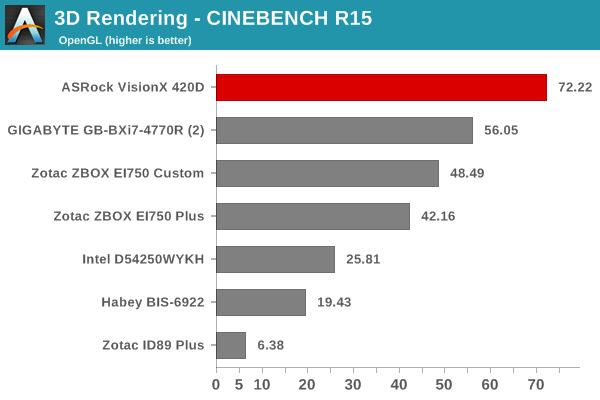
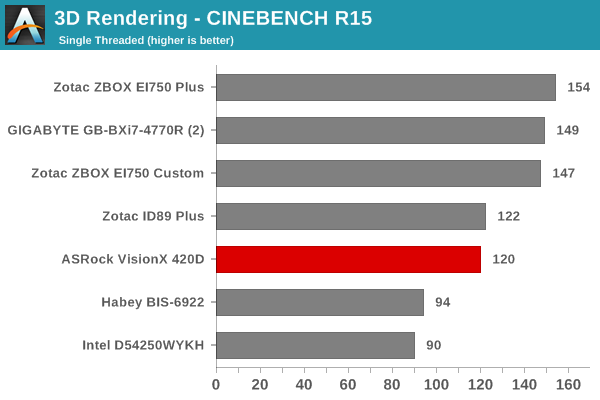
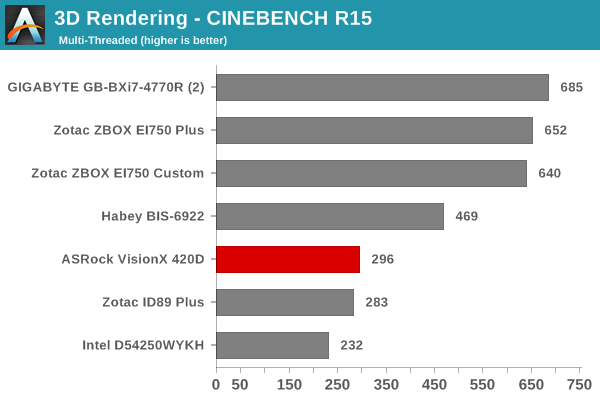
3D Rendering - CINEBENCH R15
We have moved on from R11.5 to R15 for 3D rendering evaluation. CINEBENCH R15 provides three benchmark modes - OpenGL, single threaded and multi-threaded. Evaluation of select PCs in all three modes provided us the following results.


30 Comments
View All Comments
blackmagnum - Monday, September 1, 2014 - link
Post-Anand... I see that the quality of the article still continues to impress. Thanks.lurker22 - Monday, September 1, 2014 - link
Yeah, a whole 2 days after he "officially" resigned lol. Wait a year before you evaluate ;)pectorvector - Monday, September 1, 2014 - link
The table at the bottom of the first page (look at the GPU row, Habey BIS-6922) has "Graphisc" written instead of Graphics.TheinsanegamerN - Monday, September 1, 2014 - link
Any word on temperatures? I know that toms hardware recorded temps in the 90c range with their model when it was reviewed. Did you guys observe anything similar? always wondered what would happen if you were to mill out the top and mount a nice fan there, blowing down on the components.ganeshts - Monday, September 1, 2014 - link
On the graph in the final section 'System Loading vs. Temperature Characteristics', you can see the CPU temperature rise to 90 C, but only with both Prime 95 and Furmark running simultaneously. This is hardly a valid practical use-case.I don't believe thermals are a cause for concern with this PC for normal workloads in home / office scenarios.
monstercameron - Monday, September 1, 2014 - link
come on oems put a kaveri apu in one of em!Nickname++ - Monday, September 1, 2014 - link
FYI, I have the 420D running under Debian Linux and it can idle at ~12 W. The trick is to force PCIe ASPM (power management) using a kernel option, which is disabled in the ACPI configuration but well supported as it's all laptop components. I guess disabling it reduced the testing effort. Then enabling "laptop mode" gets you there.So as usual with Linux it's not plug n' play, but it's reasonable easy to lower the power for an always on HTPC+server combo.
Another info: the Intel integrated graphics are disabled, and the AMD card is always on. With a hybrid laptop architecture I guess the idle power could get lower, like an Intel only NUC. But again, it's a simpler configuration for ASRock with a fixed set-up.
tuxRoller - Monday, September 1, 2014 - link
Linux, and open source in general, doesn't exist at this site.You might as well say beos:)
yannigr2 - Monday, September 1, 2014 - link
As long as there is no detailed info about the cpu/gpu in the charts, charts are still a red bar between gray bars that most people will never really spend time to understand what they represent. And now they are only 8 mini-PCs. If those become 12-15 or more in the future it will be a total hell of strange model numbers.ganeshts - Monday, September 1, 2014 - link
As a reader myself, I would first take a look at the table at the bottom of the first page and note down the two or three PCs that I hope to see how the PC under review fares against. The full details of each system are provided in that table with the drop-down selection.In addition, I do have data for 12-15 PCs even right now, but I choose the 6 - 7 appropriate PCs to compare against and only include those in the graphs.
It is a trade-off between having cluttered graphs (presenting all the info for the reader in one view) vs. splitting the info into two (a table on one page, and cleaner graphs on other pages - but expecting the reader to do a bit of 'work' before viewing the graphs). I went with the latter for more readability. The benchmark numbers depend heavily on the DRAM being used, the storage subsystem configuration etc., and not just the CPU / GPU. Under these circumstances, I believe the 'split into two' approach is the better one.
If you have any other suggestions on how to tackle this problem, I am all ears.