The Western Digital WD Black SN750 SSD Review: Why Fix What Isn't Broken?
by Billy Tallis on January 18, 2019 8:01 AM ESTWhole-Drive Fill
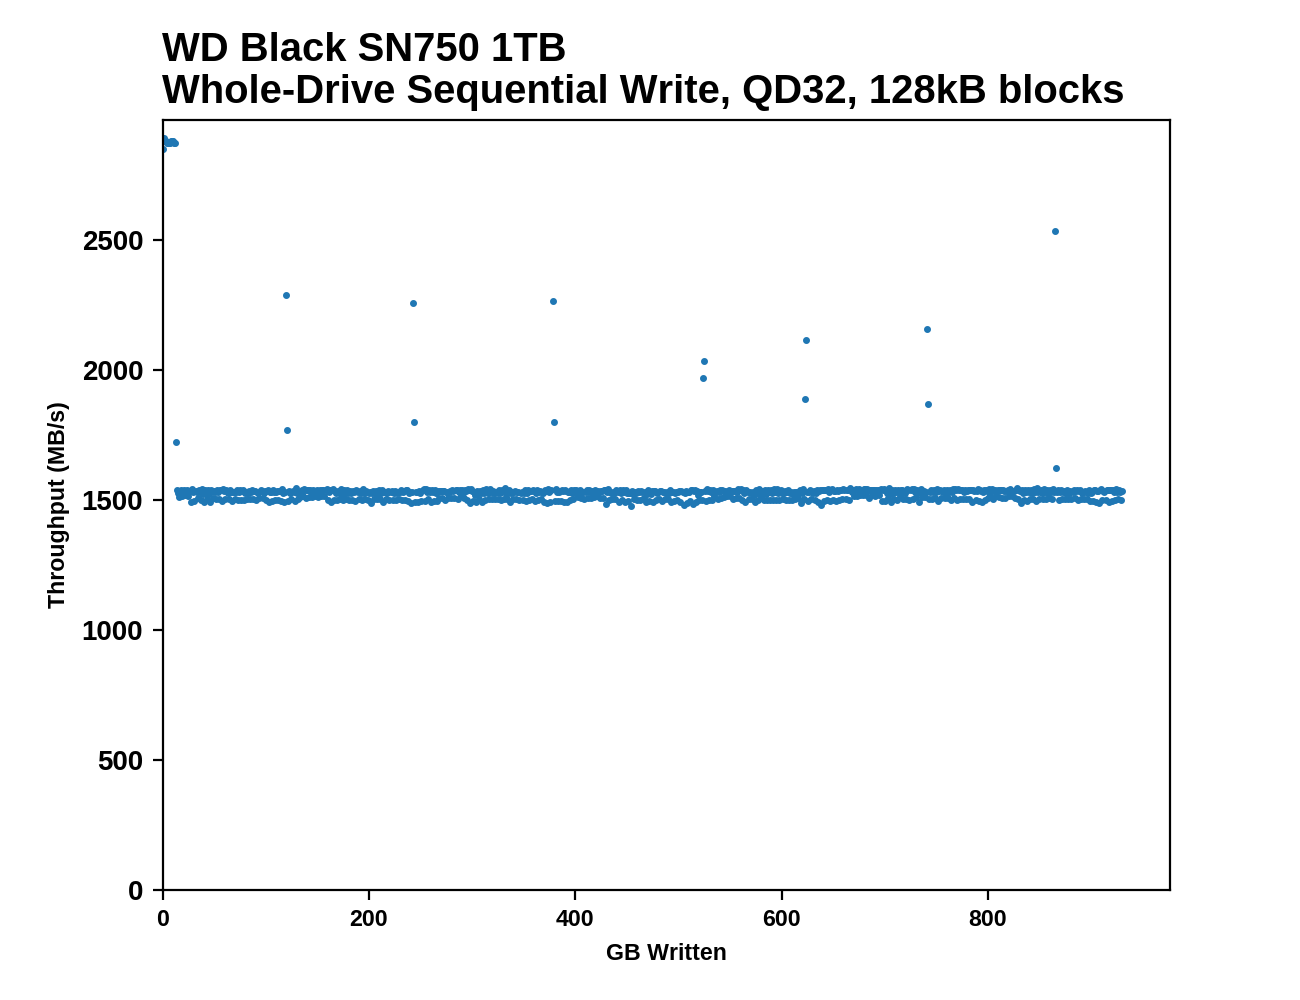
This test starts with a freshly-erased drive and fills it with 128kB sequential writes at queue depth 32, recording the write speed for each 1GB segment. This test is not representative of any ordinary client/consumer usage pattern, but it does allow us to observe transitions in the drive's behavior as it fills up. This can allow us to estimate the size of any SLC write cache, and get a sense for how much performance remains on the rare occasions where real-world usage keeps writing data after filling the cache.
 |
|||||||||
The WD Black SN750's behavior during a full drive write is quite similar to that of its predecessor, albeit with a 5% improvement in write speed after the SLC cache fills up. The cache fills after about 12GB of writes, but since performance after the drop is steady at around 1.5GB/s the small cache isn't really a problem.
 |
|||||||||
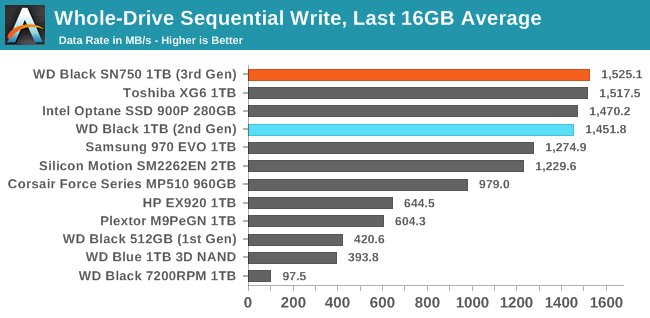
| Average Throughput for last 16 GB | Overall Average Throughput | ||||||||
The WD Black SN750 offers best in class performance for long-duration sequential writes. After the SLC cache is full, the SN750 is about 5% faster than its predecessor for filling the rest of the drive. When looking at the total time to fill the drive, the SN750's advantage is slightly higher because its write speed to the SLC cache is also a bit faster.
BAPCo SYSmark 2018
BAPCo's SYSmark 2018 is an application-based benchmark that uses real-world applications to replay usage patterns of business users, with subscores for productivity, creativity and responsiveness. Scores represnt overall system performance and are calibrated against a reference system that is defined to score 1000 in each of the scenarios. A score of, say, 2000, would imply that the system under test is twice as fast as the reference system.
SYSmark scores are based on total application response time as seen by the user, including not only storage latency but time spent by the processor. This means there's a limit to how much a storage improvement could possibly increase scores, because the SSD is only in use for a small fraction of the total test duration. This is a significant difference from our ATSB tests where only the storage portion of the workload is replicated and disk idle times are cut short to a maximum of 25ms.
| AnandTech SYSmark SSD Testbed | |
| CPU | Intel Core i5-7400 |
| Motherboard | ASUS PRIME Z270-A |
| Chipset | Intel Z270 |
| Memory | 2x 8GB Corsair Vengeance DDR4-2400 CL17 |
| Case | In Win C583 |
| Power Supply | Cooler Master G550M |
| OS | Windows 10 64-bit, version 1803 |
Our SSD testing with SYSmark uses a different test system than the rest of our SSD tests. This machine is set up to measure total system power consumption rather than just the drive's power.
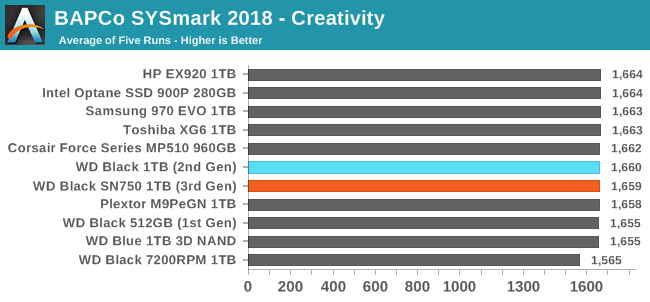
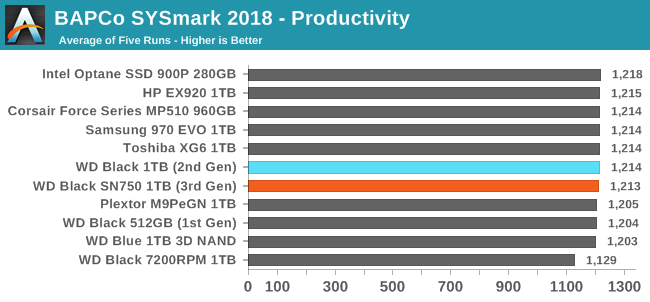
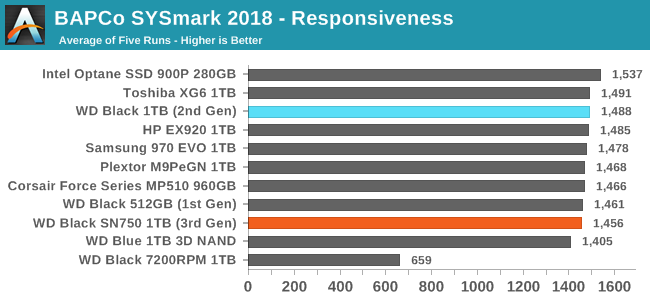
The new WD Black SN750 regresses slightly in performance on SYSmark 2018, primarily on the responsiveness test, which is the subscore that's most sensitive to storage performance. The SN750 still clearly outperforms the WD Blue SATA SSD but even managed to fall behind the first-generation WD Black that used planar TLC and a third-party controller.
Energy Usage
The SYSmark energy usage scores measure total system power consumption, excluding the display. Our SYSmark test system idles at around 26 W and peaks at over 60 W measured at the wall during the benchmark run. SATA SSDs seldom exceed 5 W and idle at a fraction of a watt, and the SSDs spend most of the test idle. This means the energy usage scores will inevitably be very close. A typical notebook system will tend to be better optimized for power efficiency than this desktop system, so the SSD would account for a much larger portion of the total and the score difference between SSDs would be more noticeable.
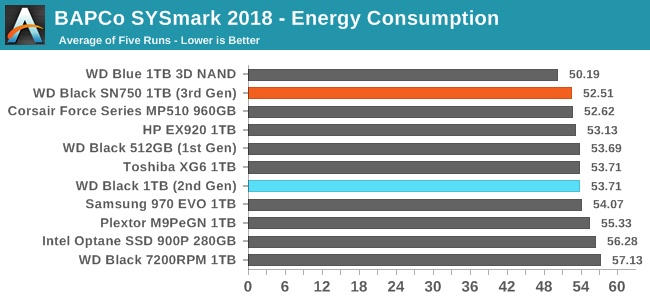
The WD Black SN750 turns in an excellent energy consumption score, lower than any drive in this bunch save for the WD Blue SATA SSD.


54 Comments
View All Comments
nevcairiel - Friday, January 18, 2019 - link
Whatever happend to the Samsung PRO in those comparisons? If you call something a "top NVMe SSD" and then don't have the PROs in there to stack up against, it feels incomplete.jordanclock - Friday, January 18, 2019 - link
Where do you see that they call it the top NVMe SSD?Comparing it to the 970PRO doesn't make a lot of sense since they are in vastly different price ranges and market segment. The 970 EVO is perfect because they are very close in price and market segment. They even admit in the conclusion that the "970 EVO may be the slightly better performer overall."
Drakkhen - Friday, January 18, 2019 - link
He didn't call it the top NVMe SSD, he said a "top NVMe SSD".But, I agree that it isn't really relevant since this comparison is for a different price point/market.
DanNeely - Friday, January 18, 2019 - link
I would like to see at at least on higher end drive that's not an Optane for comparison though.romrunning - Friday, January 18, 2019 - link
Agreedphilehidiot - Saturday, January 19, 2019 - link
I think it's always useful, regardless of where you are in the meerkat, to compare to the top and the bottom of the range. This gives you an idea of what you're getting. Am I getting 70% of top end performance for 70% of the price or am I getting 95% of it for 70% of the price? Those are two very different value propositions and certainly things we see often in the PC meerkat. Sometimes the progression with price is linear(ish) and sometimes you can spend double the cash to get the very best but really all you're seeing is a few percent extra performance because it takes that much extra R&D / materials investment to get there.29a - Friday, January 18, 2019 - link
In the second paragraph on the last page."the new WD Black is still a very competitive high-end NVMe SSD"
They do make the claim that it is a high end SSE which I would equate to being "a top NVMe SSD" and should be compared to the Samsung Pro models.
althaz - Friday, January 18, 2019 - link
Depends where you are I guess. The 500Gb WD Black is exactly the same price as the 512Gb Samsung 970 Pro where I live. Samsung's 970 EVO drives are $100/TB cheaper.Samus - Monday, January 21, 2019 - link
LOL, the 500GB WD Black is consistently close to half the price of the 980 Pro, and the 970 Pro is essentially the same performance as the EVO (hence them being similarly priced.)I agree, the 980 Pro should be in the benchmarks, but certainly not the 970 Pro. Just use the EVO as a baseline and add 3% if you want to be picky about exact figures.
Samus - Monday, January 21, 2019 - link
I forgot to add, or rather point out, the 970 EVO and 970 PRO share the same controller and are otherwise identical configurations with the exception of the PRO being MLC.That said, Samsung actually rates them near-identically in performance and aside from the SLC caching algorithm, the EVO performs the same.
The only real reason to get the PRO is if you need the DWPD\endurance of MLC. That's literally the only advantage the PRO has.