The Intel NUC8i7HVK (Hades Canyon) Review: Kaby Lake-G Benchmarked
by Ganesh T S on March 29, 2018 1:00 PM ESTPerformance Metrics - I
The Intel NUC8i7HVK (Hades Canyon) was evaluated using our standard test suite for small form-factor gaming PCs. Not all benchmarks were processed on all the machines due to updates in our testing procedures. Therefore, the list of PCs in each graph might not be the same. In the first section, we will be looking at SYSmark 2014 SE, as well as some of the Futuremark benchmarks.
BAPCo SYSmark 2014 SE
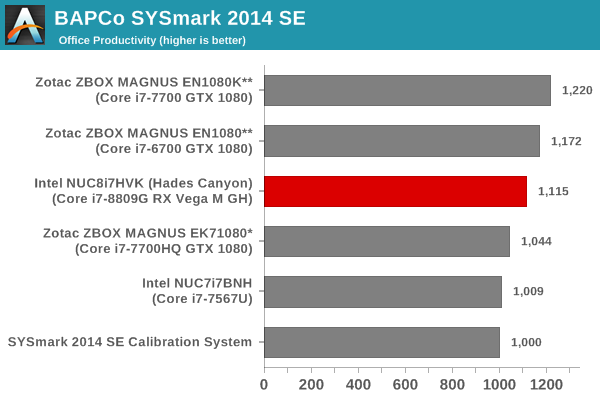
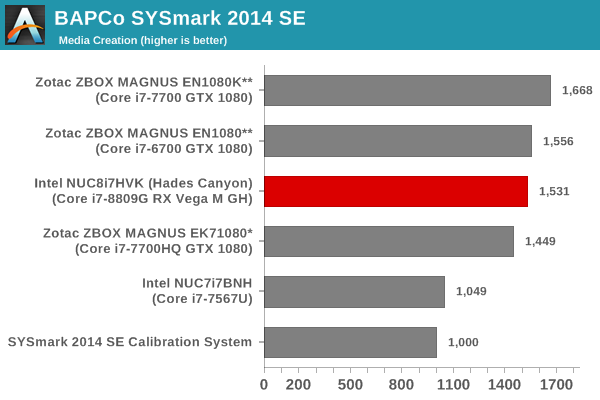
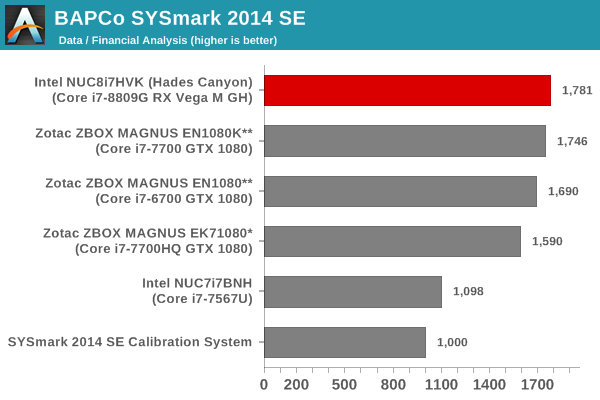
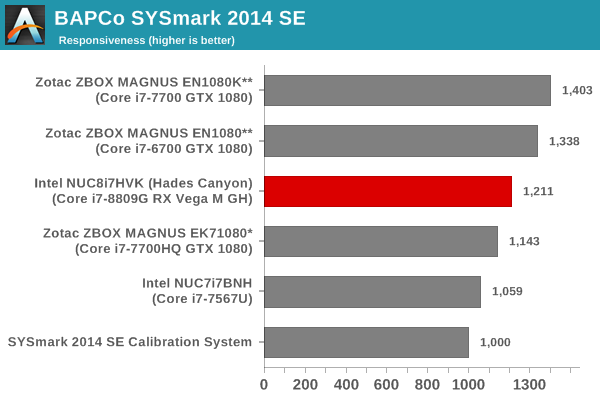
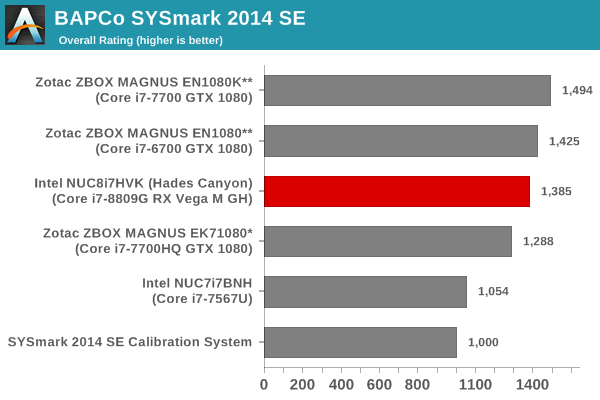
BAPCo's SYSmark 2014 SE is an application-based benchmark that uses real-world applications to replay usage patterns of business users in the areas of office productivity, media creation and data/financial analysis. In addition, it also addresses the responsiveness aspect which deals with user experience as related to application and file launches, multi-tasking etc. Scores are meant to be compared against a reference desktop (the SYSmark 2014 SE calibration system in the graphs below). While the SYSmark 2014 benchmark used a Haswell-based desktop configuration, the SYSmark 2014 SE makes the move to a Lenovo ThinkCenter M800 (Intel Core i3-6100, 4GB RAM and a 256GB SATA SSD). The calibration system scores 1000 in each of the scenarios. A score of, say, 2000, would imply that the system under test is twice as fast as the reference system.
SYSmark 2014 SE also adds energy measurement to the mix. A high score in the SYSmark benchmarks might be nice to have, but, potential customers also need to determine the balance between power consumption and the efficiency of the system. For example, in the average office scenario, it might not be worth purchasing a noisy and power-hungry PC just because it ends up with a 2000 score in the SYSmark 2014 SE benchmarks. In order to provide a balanced perspective, SYSmark 2014 SE also allows vendors and decision makers to track the energy consumption during each workload. In the graphs below, we find the total energy consumed by the PC under test for a single iteration of each SYSmark 2014 SE workload and how it compares against the calibration systems.
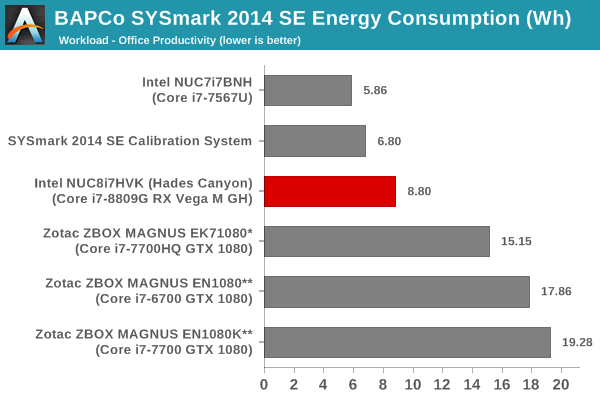
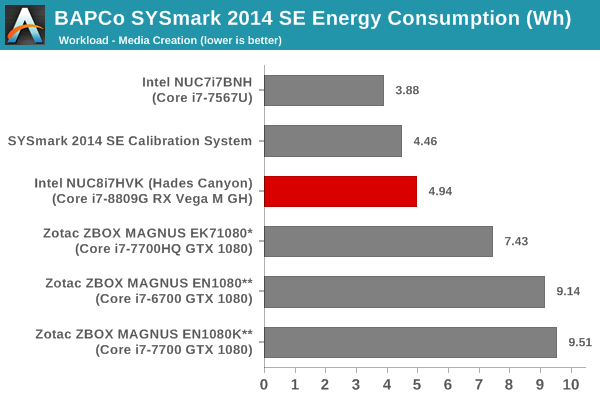
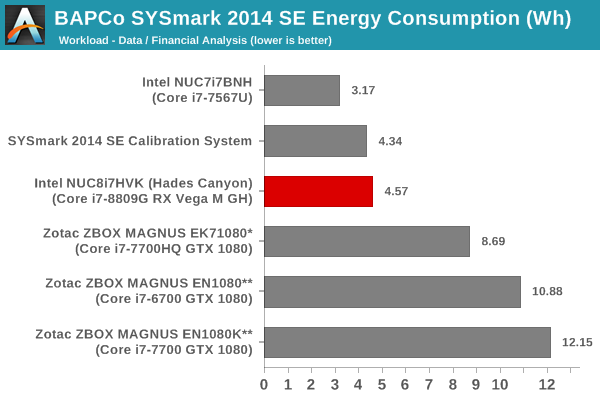

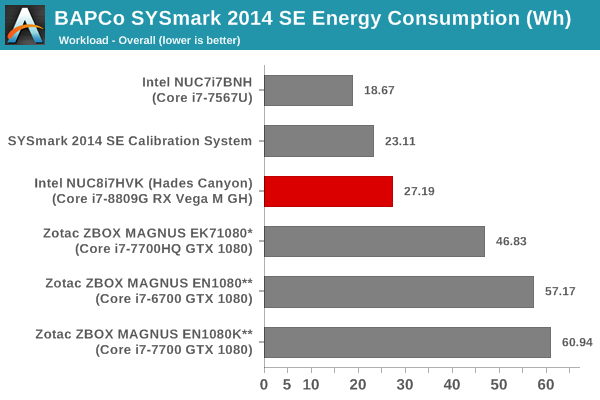
Despite being fully patched for Meltdown and Spectre, the Core i7-8809G manages to outscore the partially patched Core i7-7700HQ-based ZBOX MAGNUS EK71080. It is beat in terms of raw score by the ZBOX MAGNUS PCs using the desktop CPUs (Core i7-6700 and Core i7-7700), but, those PCs consume much more energy to complete the workloads.
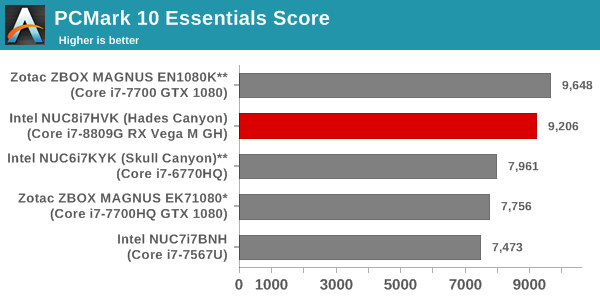
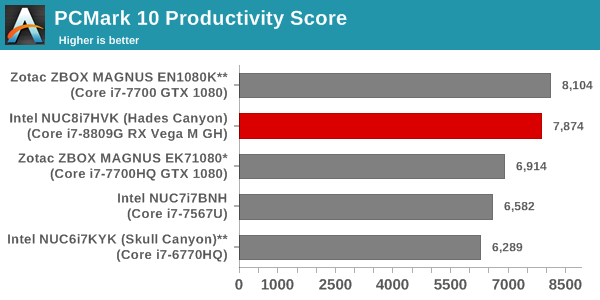
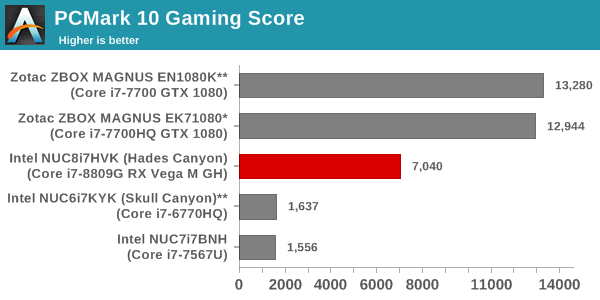
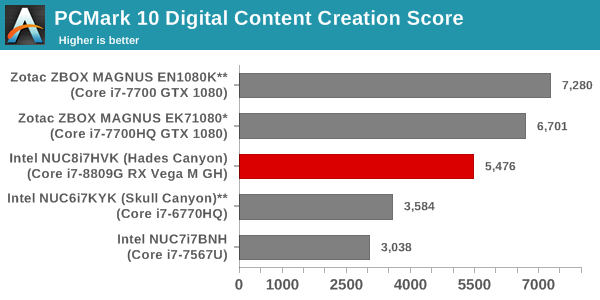
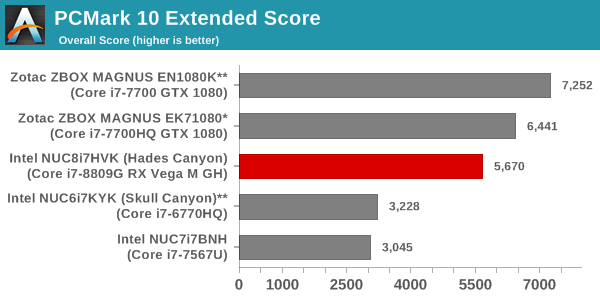
Futuremark PCMark 10
UL's PCMark 10 evaluates computing systems for various usage scenarios (generic / essential tasks such as web browsing and starting up applications, productivity tasks such as editing spreadsheets and documents, gaming, and digital content creation). We benchmarked select PCs with the PCMark 10 Extended profile and recorded the scores for various scenarios. These scores are heavily influenced by the CPU and GPU in the system, though the RAM and storage device also play a part. The power plan was set to Balanced for all the PCs while processing the PCMark 10 benchmark.
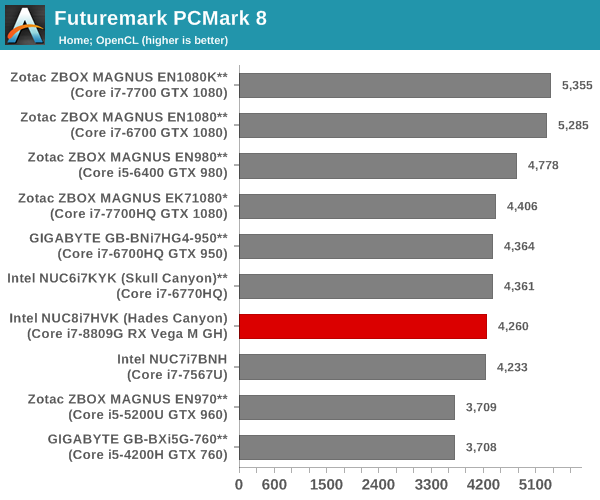
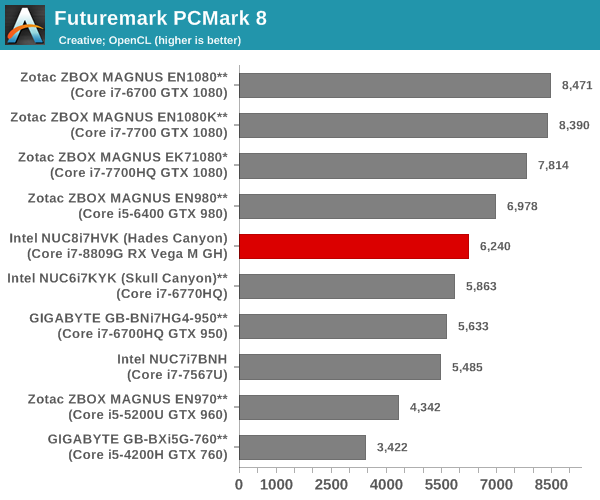
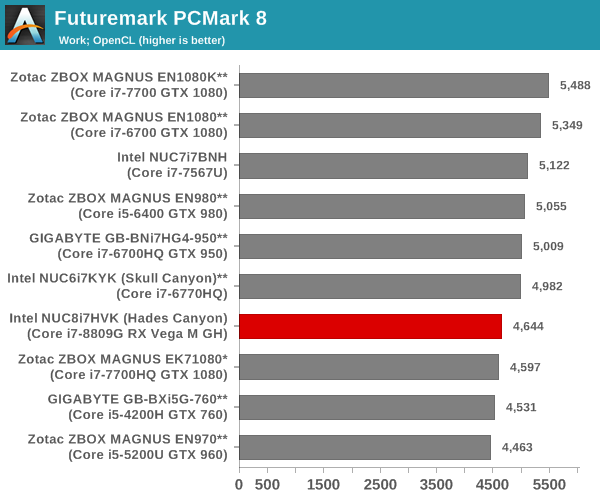
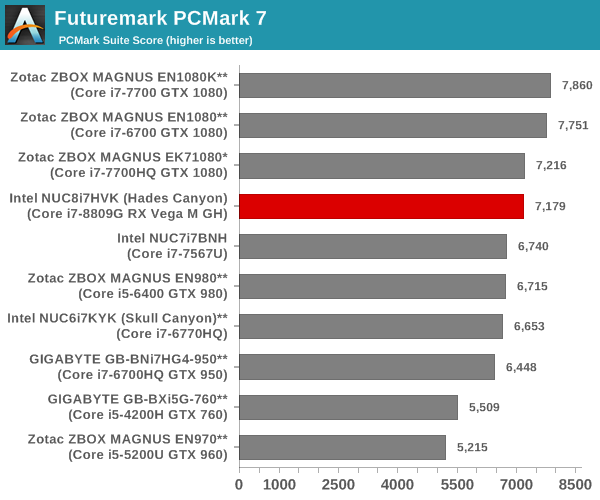
Futuremark PCMark 8
We continue to present PCMark 8 benchmark results (as those have more comparison points) while our PCMark 10 scores database for systems grows in size. PCMark 8 provides various usage scenarios (home, creative and work) and offers ways to benchmark both baseline (CPU-only) as well as OpenCL accelerated (CPU + GPU) performance. We benchmarked select PCs for the OpenCL accelerated performance in all three usage scenarios. These scores are heavily influenced by the CPU in the system. The results should be analyzed while keeping in mind that most of the comparison systems have scores from the days prior to the release of the Meltdown and Spectre patches.
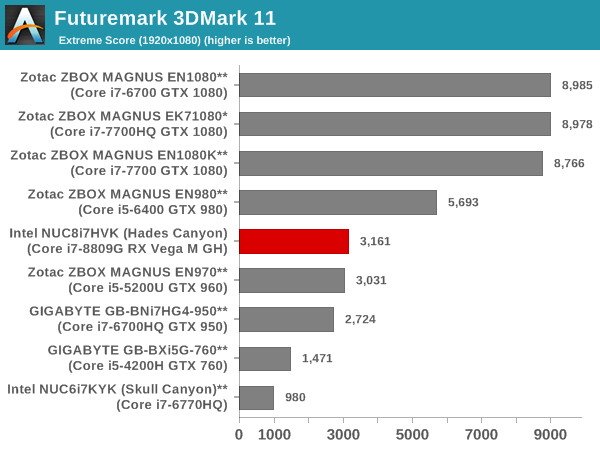
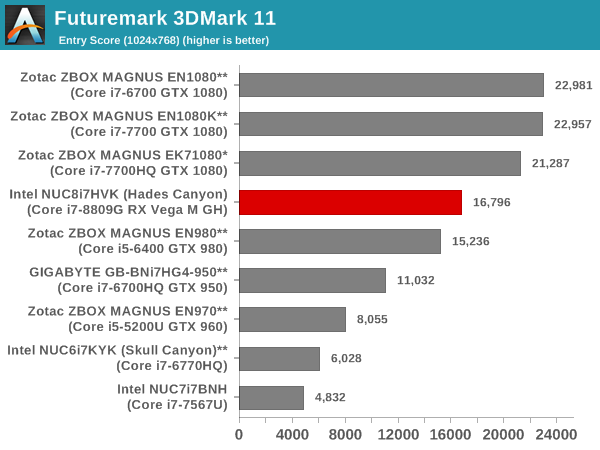
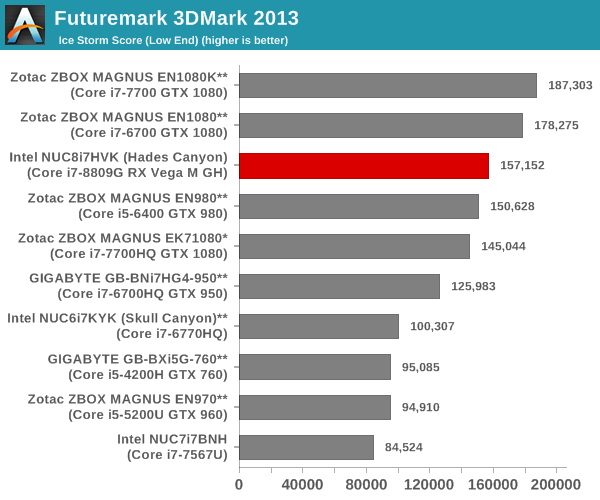
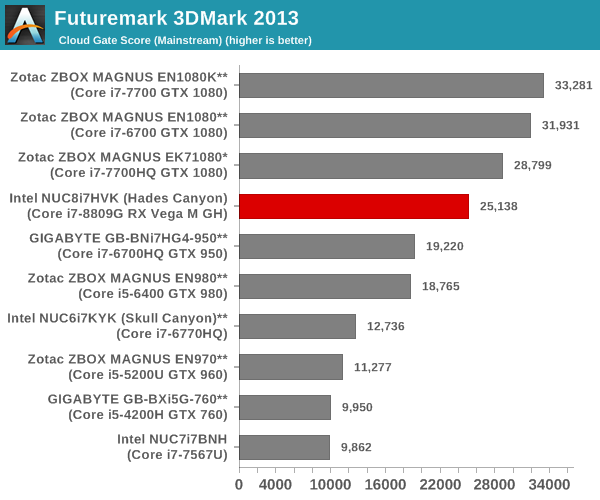
Miscellaneous Futuremark Benchmarks
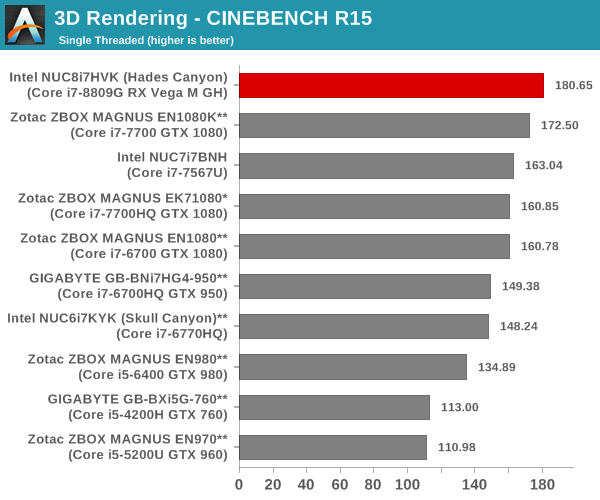
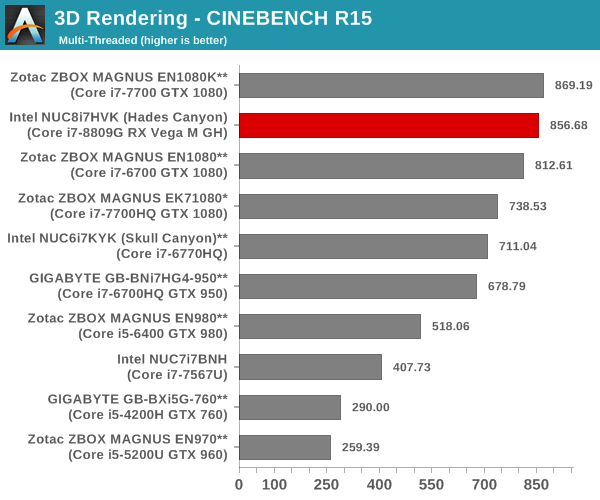
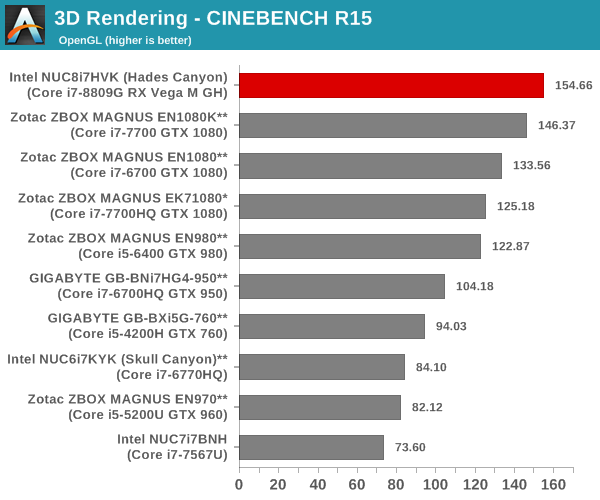
3D Rendering - CINEBENCH R15
We have moved on from R11.5 to R15 for 3D rendering evaluation. CINEBENCH R15 provides three benchmark modes - OpenGL, single threaded and multi-threaded. Evaluation of select PCs in all three modes provided us the following results. Here, we see the benefits of running the CPU die with a 65W TDP. The scores match or beat the results from the Core i7-7700 in the ZBOX MAGNUS EN1080K.


124 Comments
View All Comments
astromoose - Thursday, March 29, 2018 - link
How loud is it under load?ganeshts - Thursday, March 29, 2018 - link
If you are gaming with the volume up, then it is a non-issue. On a comparative basis, it is much better than the ZBOX EK71080, but, not as good as the liquid cooled ZBOX E-series. I would say it is as loud as the Skull Canyon - but, it doesn't enter the noisy territory as much. Some hard numbers on the Skull Canyon can be found here : https://www.reddit.com/r/intelnuc/comments/7ga2q9/...Crazyeyeskillah - Thursday, March 29, 2018 - link
This would be a nice 1 fit solution for an arcade emulator cabinet. No issues with lower resolution and could essentially run anything you throw at it!Crazyeyeskillah - Thursday, March 29, 2018 - link
nevermind, the 1700$ price tag is laughableCrunchy005 - Thursday, March 29, 2018 - link
"As Configured"...they put a 118GB optane drive + a 512GB SSD on top of 16GB RAM. Optane is already not necessary.So get the Kit $999
DDR4 16GB SO-DIMM 2x8GB $167
500GB SSD $125
Windows OS $100(or less depending on how you get it)
$1391 if you need to buy windows
$1291 if you already have a windows license
06GTOSC - Tuesday, April 3, 2018 - link
That's still a lot. Yes it's fairly capable. But for $1300-1400, you can build a much more capable desktop. Yes it'll be larger. But I think space is hardly the issue for most unless you're looking for a LAN machine.xeal - Wednesday, May 2, 2018 - link
You will change your opinion *drastically* if you ever decide to live in (or even visit) Japan.TEAMSWITCHER - Thursday, March 29, 2018 - link
Reading the unwritten ... Not good for 4K gaming ... Got it.ganeshts - Thursday, March 29, 2018 - link
Even Intel is marketing this as a 1080p gaming machine - guaranteeing 60fps for most titles at that resolution.Cooe - Thursday, March 29, 2018 - link
I'm sorry, but what kind of lunatic expected Kaby Lake-G to be able to game at 4K??? Ridiculously stupid expectations are ridiculously stupid.