Analyzing Intel Core M Performance: How 5Y10 can beat 5Y71 & the OEMs' Dilemma
by Brett Howse & Ian Cutress on April 8, 2015 8:00 AM ESTThe Devices and Test
For today's article we have run a sampling of devices through several benchmarks which vary in workload substantially. Some are single-threaded and some are multi-threaded - some emphasize burst performance, and some focus on sustained performance. Some involve the GPU and some do not. During all of the benchmarks, CPU frequencies, GPU frequencies, and processor temperature were logged. The devices are all different as well, and offer different takes on Core M.
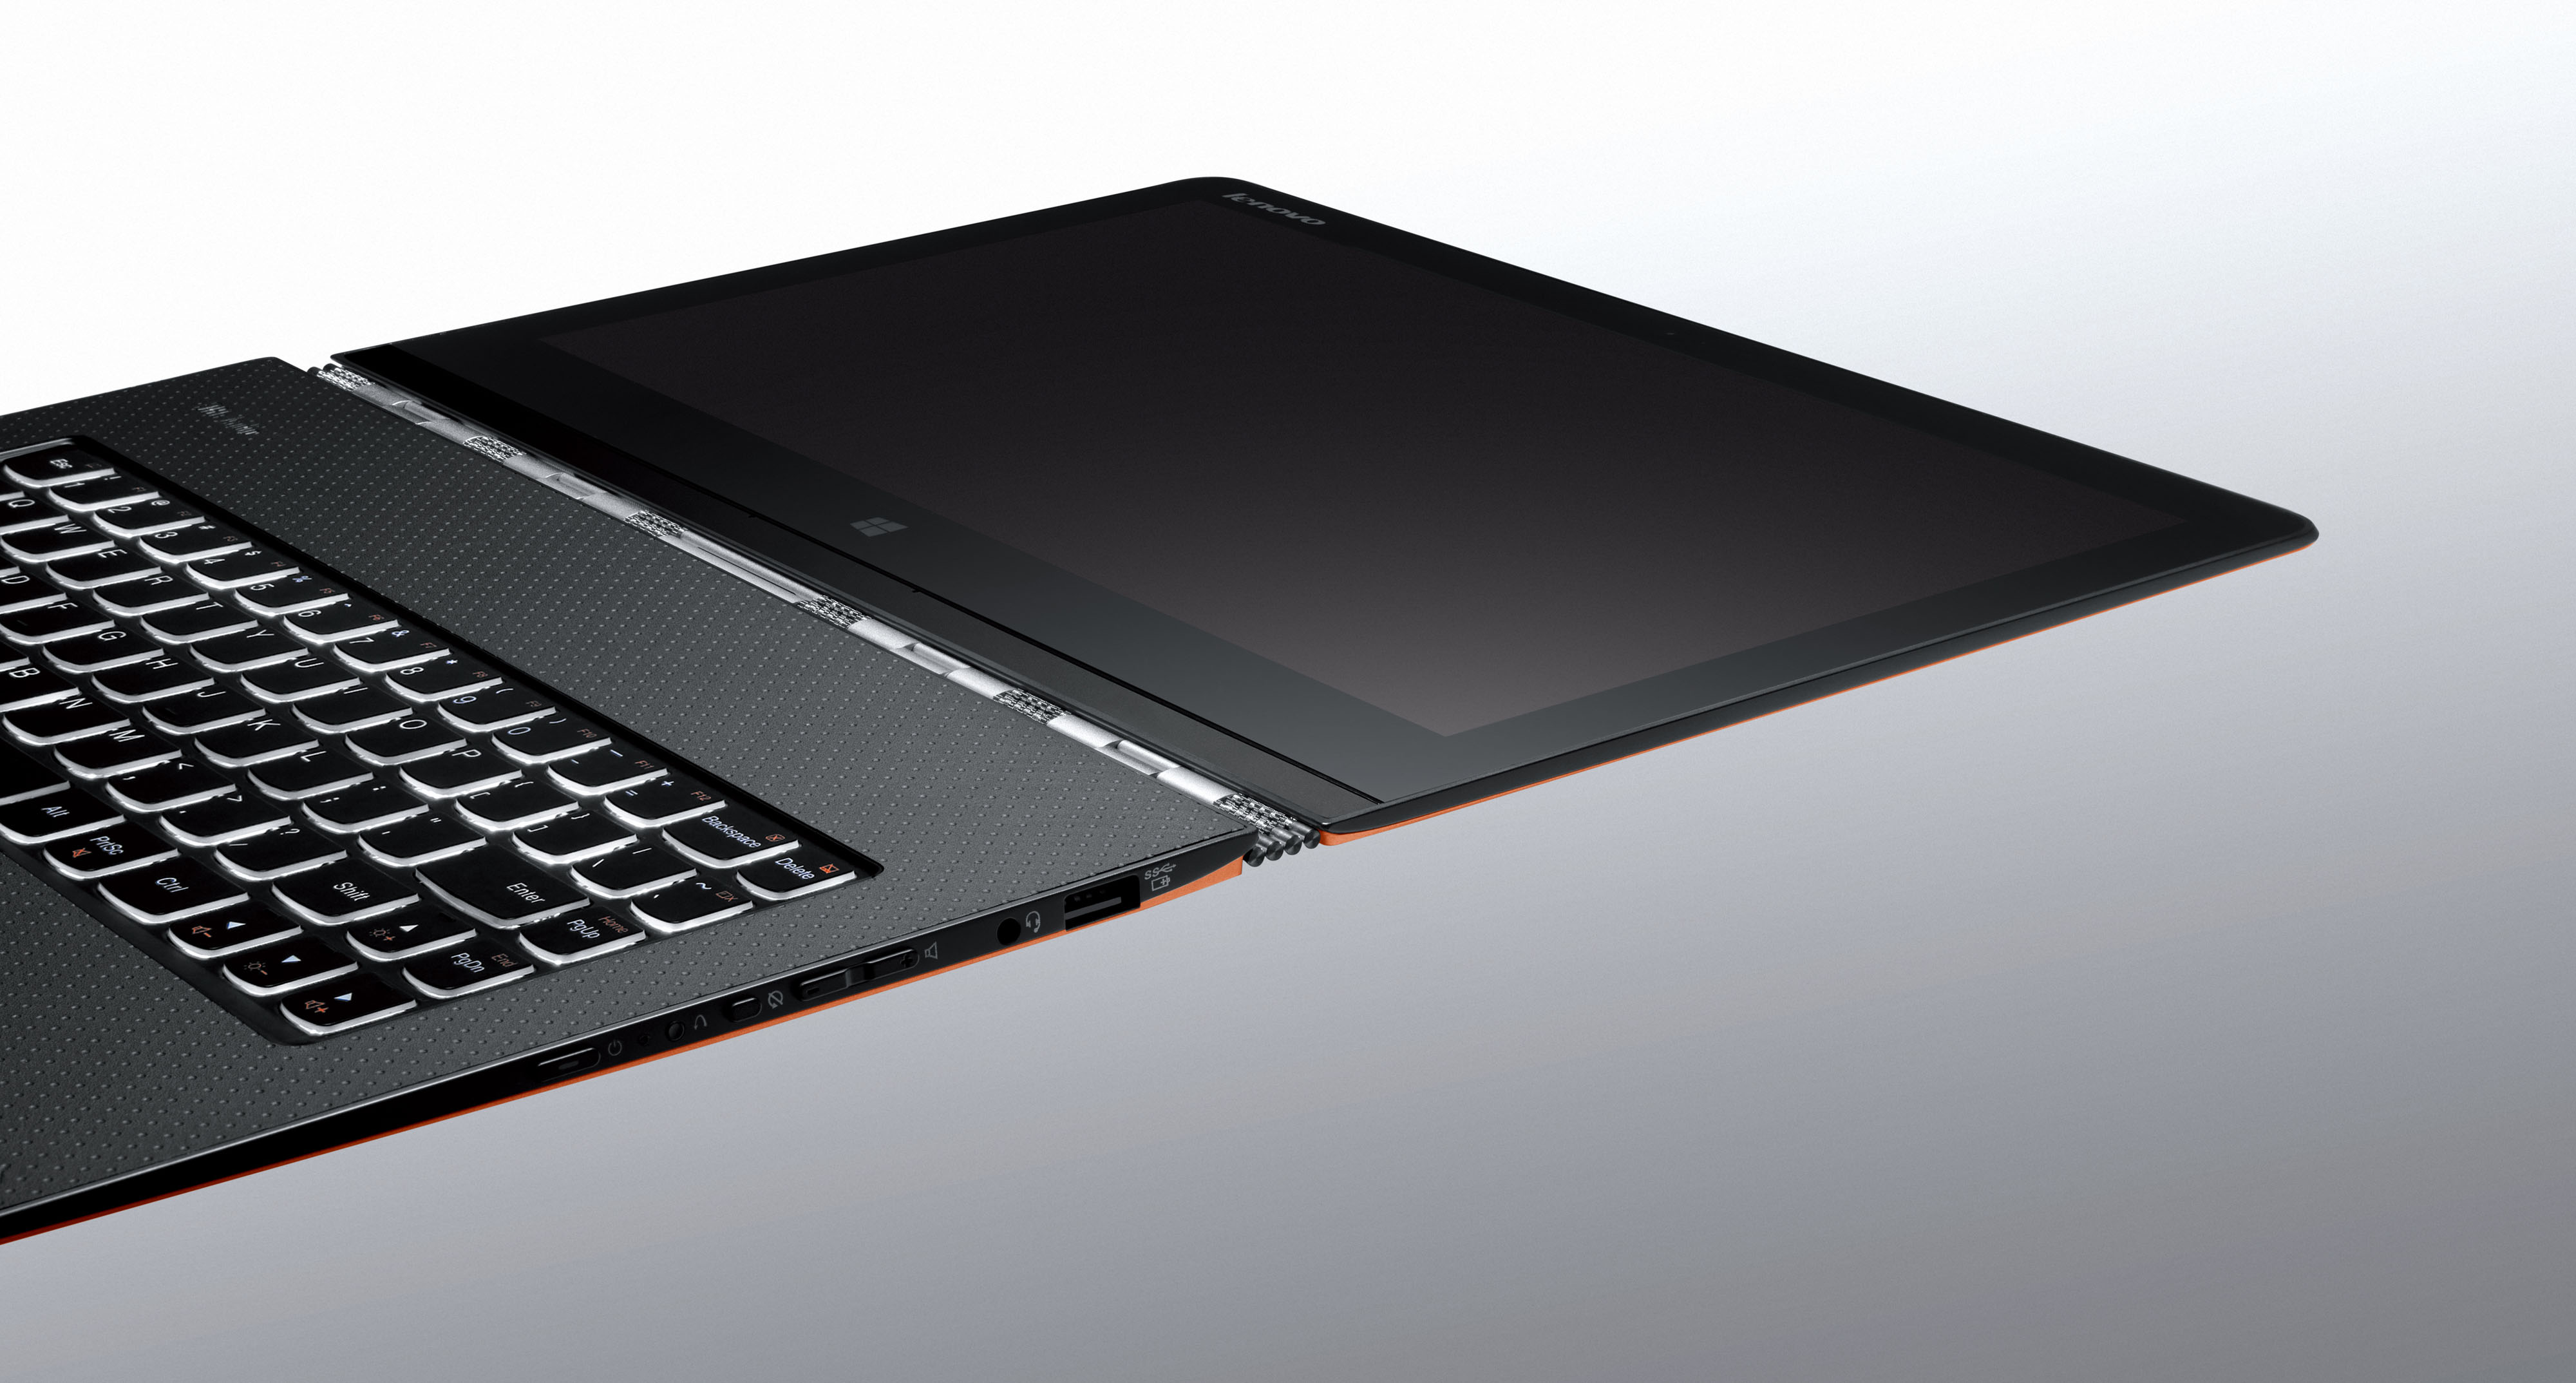
The first device is the Lenovo Yoga 3 Pro. This is the same device that we reviewed, and it features a Core M-5Y71 processor which is the very top of the Core M range. Lenovo has chosen to include a fan, so this is the only one of the Core M devices being included that is actively cooled. Being a convertible laptop, Lenovo must be more wary of surface temperatures than a traditional laptop since the Yoga 3 Pro can be used in the hand as a tablet.

The second device is the ASUS Zenbook UX305, which was recently reviewed as well. This features a Core M-5Y10 processor, which is the lowest-end model available. The UX305 is passively cooled and features an entirely aluminum chassis, which helps to dissipate the heat generated. As a laptop, higher surface temperatures can be manageable since the device is normally sitting on the raised feet and not in direct contact with skin.

The third device is the Dell Venue 11 Pro 7000, which also features the top end Core M-5Y71. This is a tablet first and foremost, and is also passively cooled. The Venue features a plastic rear casing, and as a tablet surface temperatures must be taken into consideration.
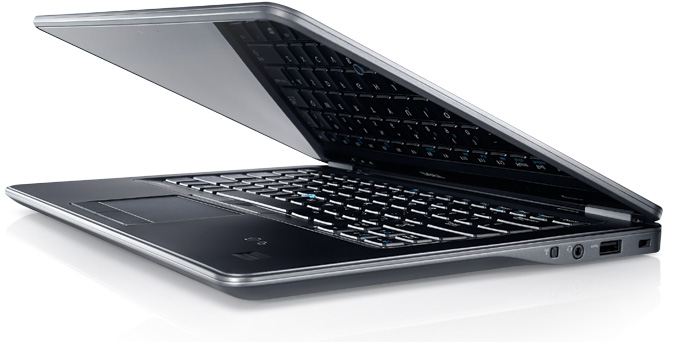
The final device is the Dell Latitude 14 7000, which is powered by the Core i5-5200U processor. Being a much higher TDP part, but largely the same architecture, will give a reference point on what Broadwell will do when given better cooling. The sample received has only one channel of memory, which will mostly affect the GPU scores. Dell does offer dual-channel memory, so this device can perform higher than the sample that we have.
Overall the Core i5-5200U is much less dynamic than Core M, with a base CPU frequency of 2.2 GHz and boost of 2.7 GHz. If you will notice, the boost is actually less than the Core M-5Y71, so assuming adequate cooling, or short enough workloads, Core M could in theory outperform the i5, which is something we did see on some benchmarks in the Yoga 3 Pro review.
The average computing day for anyone is going to be wildly different depending on what tasks they are performing. A lot of tasks however are very much burst workloads. As an example, browsing the web means loading the page, which is mostly done upfront. These kinds of workloads will play well into what Core M can do. Boost up to the maximum frequency, get the work done, and then fall back down to the base frequency and cool off. This is the epitome of Intel's hurry up and get idle philosophy.
However not every workload is like this. Gaming for example is a lot of consistent work, done over a long period of time, so cooling is the key here to keep performance up.
To sample a wide variety of workloads, I have picked a variety of benchmarks which are both short and long, do burst work or sustained work, and some involve the GPU and others do not.
Cinebench R15 Single-Threaded: This benchmark performs rendering on a single CPU core, so it should showcase higher clock speeds and good single-threaded performance. The benchmark lasts roughly ten minutes.
Cinebench R15 Multi-Threaded: The same benchmark, but the work is performed on all available cores, including hyper-threading. This benchmark is roughly three minutes.
PCMark 8 Home and Creative: Both the Home and Creative suites of PCMark 8 feature a variety of workloads. Home includes workloads for web browsing, writing, gaming, photo editing, and video chat. Creative includes web browsing, photo editing, video editing, group video chat, media transcoding, and gaming workloads. Home is around thirty minutes, and Creative takes about an hour to complete.
TouchXPRT 2014: This benchmark performs beautify photos (add filters, HDR, etc), blend photos, convert videos for sharing, create music podcast, and create slideshow from photos. Each task is timed, and a lower time results in a higher score. This benchmark takes about ten minutes to finish.
3DMark Sky Diver and Cloud Gate: 3DMark is a staple of our reviews. Both run through several graphics and physics tests which work both the CPU and GPU. Sky Diver is the more difficult of the tests. Sky Diver is about five minutes, and Cloud Gate is about three minutes.
3DMark Ice Storm Unlimited: This test is completely off-screen, and allows for comparison of the graphics across devices and even platforms. Being that it is available for smartphones and tablets, it is a much lower demand on the GPU, and completes very quickly on a PC with the entire benchmark being complete in about a minute.
DOTA 2: This incredibly popular online multiplayer battle-arena game is our final benchmark. This is the same workload performed for the DOTA 2 benchmark we have for reviews, only we run it for the full length of the recording. The entire run is around 45 minutes.
The following pages are very graph heavy, with some of the graphs being quite wide to show the sustained performance of the device over the benchmark run. Below is a gallery of all of the images, in order, which can be references as larger images in a separate window.


A note about the graphs. Each benchmark will show an entire run on each device, and then some combined graphs with the individual scores compared against the other devices. Due to the sampling rate, it may appear that some devices finished the benchmark before the others, but this is not always the case. Several of the devices were too loaded to always log to the text file, so they may have less entries, and appear to get the work done quicker if just comparing based on the time scale. The important data on the combined graphs is how each device handles the entire workload versus the others. We have also included the scores from each device to see where they finish the benchmark.


110 Comments
View All Comments
zepi - Wednesday, April 8, 2015 - link
Surface pro 3 is ~50% thicker than iPad Air 2, weights ~50% more, has active cooling and still has poorer performance than Surface Pro 2.From my point of view Surface pro 3 proves that Haswell-U can't power ultra-thin x86 tablets.
lilmoe - Wednesday, April 8, 2015 - link
Didn't know the iPad was an ultra-thin x86 tablet that replace your laptop. Good to know, thanks.I get that the iPad has a huge fan base, I really do. But would you guys please stop comparing it to real PCs in tablet form already??
zepi - Thursday, April 9, 2015 - link
Central argument proposed was that SP3 somehow proves that Haswell-U can power ultra-thin X86 tablets. There were no mentions about Windows or OSX compatibility in original statement.Keyword is Tablet. x86, ultra-thin etc. are describe terms. You don't need to go far and see that the statement is clearly false. Ultra-thin in context of tablets means these days that thickness of the device should to be somewhere around 6-7mm. SP3 is 9mm. I picked iPad Air 2, because it is the most well known of competitors. We could just as well use Dell Venue 8. Ipad thickness is 6.1 and Dell is 6mm thick. Later is even x86 and runs windows
Weight was another thing. Naturally comparing weight to Venue 8 makes very little sense since SP3 has over twice the total screen area of Venue 8 so I compare it with iPad air 2, which has the biggest screen area of the most well known tablets in the market. Most certainly, there are some less well known 12" models, but they are not widely spread and have hardly any market penetration.
I cannot see how SP3 would prove that 15w TDP allows for compact tablet designs. SP3 is already thermally limited and mostly proves to me that in order to reach smaller and thinner designs, lower power SOC's are necessary. From my point of view SP3 is full computer which offers decent (though arguably best in class) tablet usability in addition of being dockable general purpose PC-computer.
digiguy - Wednesday, April 8, 2015 - link
come on, you change the comparison in the same sentence, SP3 is thinner and lighter than SP2, and has has higher res screen. As for ipad air, try to run Windows on it....Jaybus - Wednesday, April 8, 2015 - link
Or even if it ran OSX. The iPad is a giant iPhone. If it ran OSX, then we could compare it to SP3. For now, iPad can only be compared to Android tablets.xthetenth - Wednesday, April 8, 2015 - link
Being thicker than slower devices and slower than thicker devices only proves that it fits between them on a size/performance scale and does nothing to show that it's not a good device.ppi - Wednesday, April 8, 2015 - link
My desktop is also thicker than iPaid Air2, weighs more, has active cooling and certainly eats more power. So ... ?You have to realize, that this 4.5W chip actually has performance that is in league with 15W chip. For many ultrabook/2-in-1 use cases ideal chip. And read the Yoga3 review, where on CPU-bound benchmarks, Core-M runs circles around A8X.
frozentundra123456 - Wednesday, April 8, 2015 - link
I agree with some of the other posters. The problem is the price of these devices for the performance. I can see them for say business use, where the company is paying, use is light, and mobility is important (say for a sales rep who travels a lot), but otherwise, I cant see Joe Average Consumer paying north of 1000 for these when you can get similar perrformance for less in a 350.00 conventional laptop or less performance, but still decent in a 100 to 300 dollar atom device.xthetenth - Wednesday, April 8, 2015 - link
The ASUS is in the 700 dollar range and avoids a great many other compromises cheaper devices would make. It fits into the price/quality scale very nicely.zepi - Wednesday, April 8, 2015 - link
From gaming / usability perspective the average-results do not necessarily tell enough.Ie. does the usage experience of certain devices suffer because GPU / CPU throttles too much under certain loads?
Are the bottom 10% frametimes so horrendous on throttling devices that DOTA-gaming is practically out of question despite relatively small difference in average frame rates?