LG 29EA93 Monitor Review - Rev. 1.25
by Chris Heinonen on February 12, 2013 8:49 PM ESTOnce again we are copying our charts from our Tablet and Smartphone workflow here for monitors. As I mentioned earlier, you can’t compare these to prior results due to the use of dE2000 for numbers. Another key change here is the ability to use meter profiling for doing measurements, which I’ll elaborate on here a bit to put these numbers into context.
There are two main types of meters: colorimeters and spectrometers. Colorimeters are usually cheaper, and use color filters to read the different colors of light. Spectrometers often cost more but actually “read” the light instead of using filters. This difference is key as color filters were very good when the only light sources were CRTs or CCFL lamps, but now with White and Multi-colors LEDs, and OLED displays, we have light with a different spectral makeup than before, which the filters are often not designed around. This can cause a colorimeter to have incorrect readings but a spectrometer will not.
The reason we don’t always use spectrometers is because they are much slower, and they read at low light much worse that a colorimeter. With meter profiling, you use a spectrometer and colorimeter to read colored patches from a display, and then the software analyzes the results. This creates a 3x3 correction matrix for the colorimeter that then allows it to correctly read the light from the display, even if it is LED or OLED based. The key thing here is this now allows us to read shadows better, and do more readings to produce better results.
The main area of difference here is going to be in blues. Compared to 100% White, 100% Blue has only 7% of the light output, making it very dim. This makes it harder to read for a spectrometer, which makes it more prone to error. Now that we can use a profiled colorimeter to make this reading, and in my case use a C6 meter that can average 10 results at a time to produce a more accurate number, our blue numbers may be different than before, but they will be more accurate.
| Pre-Calibration | 200 cd/m² Target | 80 cd/m² Target | |
| Primary and Secondaries dE2000 | 2.3002 | 1.4839 | 2.0847 |
| Colorchecker dE2000 | 2.1689 | 1.0185 | 0.9915 |
| Saturations dE2000 | 1.7017 | 1.0126 | 1.1254 |
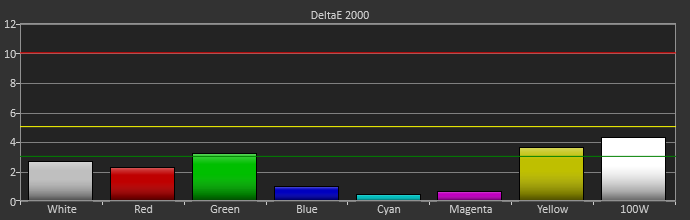
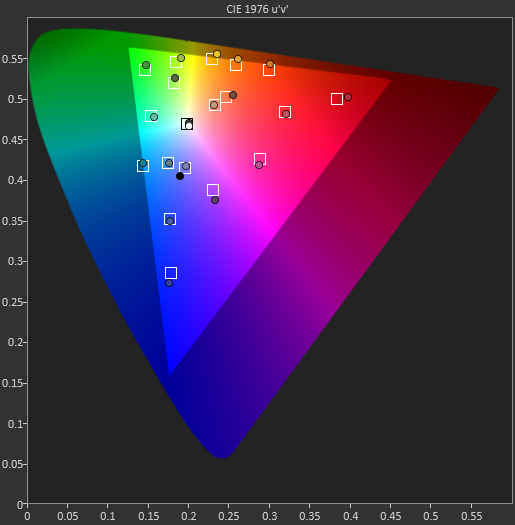
With that out of the way, we can look at the CIE gamut chart and see that the LG 29EA93 has a bit more than the sRGB gamut available, with reds and greens that extend beyond the CIE triangle. Pre-calibration our numbers look very good, but with a bit of over-saturation in the reds and greens. The 200 cd/m² calibration numbers look better than the 80 cd/m² when it comes to the CIExy chart, but frankly I’m more concerned with the color checker and saturation charts. Most people only focus on the CIE chart, but it really just shows the performance of 6 colors and the size of the gamut, but tells you nothing about the performance of the other 16.7 million colors you might use.

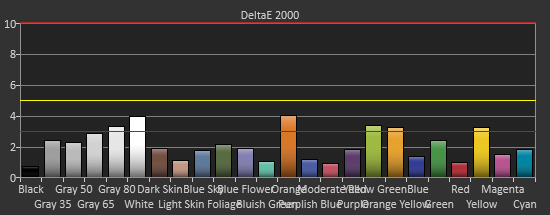
Pre-calibration, the dE2000 number for the Color Checker chart is quite good on the LG 29EA93. Until we have more monitors done with the new workflow we can’t be certain of how good this is, but overall it does look very nice. The main issues are in pure white, and those Yellow-Red-Green tones that fall at the edge of the gamut. The bit of over-saturation that we saw earlier causes these to be a bit too-rich and leads to some visible errors there.
After calibration, only those over-saturated colors provide anything to care about at all. Beyond those four points, the other 20 samples are nearly perfect, with no visible error at all even in blues. If those final four points were perfect there would be nothing to complain about at all with the LG 29EA93, but even with them it produces overall dE2000 numbers that are fantastic.
Pre-calibration, the saturation numbers for the LG are good, but you can see quite a few of the measurements are at or close to the dE2000 3.0 mark. Post-calibration this improves, especially the 20% data, with only the 100% green and yellow color swatches measuring over 3.0, and only four measurements total over a dE2000 of 2.0. The calibrations push the saturation measurements from good to excellent.

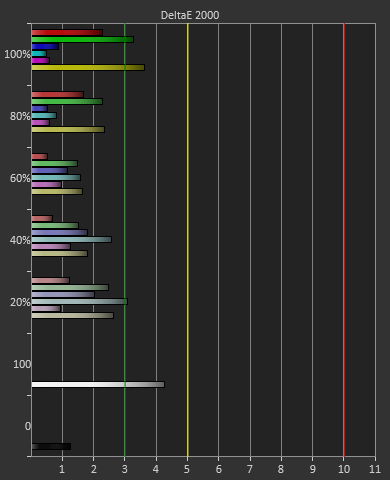
Taking these measurements in full, it seems that after calibration, the only place you will see any color errors on the LG 29EA93 is in a fully saturated red, green, or possibly yellow. As soon as the saturation drops below 100% the error level drops drastically, and you won’t be able to see an error at all. Unless you start at a pure-red screen all day long, the color of the LG 29EA93 is going to be very impressive.


108 Comments
View All Comments
cheinonen - Monday, February 18, 2013 - link
You really don't want this, as while content above 235 is technically not support to exist, some does in the form of specular highlights and other very bright items. Displays or sources that automatically clip this WTW material are possibly losing some image information and shouldn't work that way.name99 - Thursday, February 14, 2013 - link
I don't want to be a dick, but the colors used in the bar charts are truly horrible --- the kind of colors that look like they are bleeding out of the bars.Please revert to the colors you used to use, or ask a designer to choose new colors (or just copy them from any piece of software that has already thought about this issue, eg the default colors used in bar graphs by Mathematica or Numbers).
Spoelie - Friday, February 15, 2013 - link
Something must be wrong with your monitor, they look fine to mebjevers - Friday, February 15, 2013 - link
I see Fry's has this monitor listed on their website. Is this the US version 1.25?http://www.frys.com/product/7511746
mcfrumpy - Friday, February 15, 2013 - link
I saw the same thing so I went to the Fry's by my place that said that had it in stock. The display model had a manufacturing date of Dec 2012 and Rev00 so I'm guessing it's the old one. My bet is the ones they are selling are older since no one else seems to have it in stock.I'll admit looking at the display model I was surprised how small it looked. For as long as it is, the height of the monitor reminds me a 21 or 22 inch monitor.
SpartanGR - Friday, February 15, 2013 - link
LG must find a way to fix this. I mean everyone will want the 1.25 version now.Dracusis - Sunday, February 17, 2013 - link
"Disabling the game mode only introduced another 1-2ms of lag, but at the expense of image quality, so I would leave it disabled."Hmm...
I'm guessing you meant something like:
"Enabling the game mode shaved off another 1-2ms of lag, but at the expense of image quality, so I would leave it disabled."
Regardless, what is this "Game mode" what what exactly does it do to the image quality?
The rest of the article was brilliant, so much detail and careful measurement. Then in one line you toss in this randomly subjective opinion and don't even qualify it when an explanation - I feel totally trolled right now.
SpartanGR - Monday, February 18, 2013 - link
I've spoken to a local seller in Korea and asked him which version they have. Had my hopes up guys but here 's his answer.Hello. Thank you for your interests
I contacted to LG, there was no official firmware update.
And the product we have in stock is the early released version.
Please feel free to ask if you have any further questions.
Thank you. Have a good day!
Best regards,
- dream-seller
Damn! i guess this is going to take a while
Wesley - Monday, February 18, 2013 - link
As others here have probably pointed out, a monitor like this has the potential to vastly improve the field of view in games, especially with some titles that may already have widescreen or multi-monitor enhancements. The images posted up comparing in-game screenshots were nice (thanks for going into that trouble), but perhaps a video demonstrating how things change on a monitor of this size would be better?For example, playing third-person games would enable a larger field of view but how does this affect the first-person perspective? Racing games all too often stretch the sides of the car when you're playing in cockpit view and the image becomes warped when playing in a multi-monitor environment. Would this screen give RTS players some advantage? Starcraft 2 can run on a MBP with the Retina display at native resolution. As a gamer myself, resolution becomes pretty important and I'm tired of 1920x1080. My only options are sinking cash into a 27" Korean monitor, a 30" monster, or something like this, which isn't that much larger but may be more beneficial.
macin - Tuesday, February 19, 2013 - link
It's 4 am and I am half asleep so bare with me here.So LG is so bothered by a review of a $700 monitor that they revise it. Great.
I am happy to hear that a company actually cares enough to seek feedback to make something better.
Why is it that the only company that line calibrates monitors is Apple?
If LG wants to stand out among other panels, why not do this for the customer as well?
Once spoiled to 2650 x 1440 and the color accuracy of Apple monitors, I can't find anything else I like.
I don't own $2k worth of calibration equip and I can't "eye" anything and get it accurate, but I know it when it see it.
I can see the difference between an out of the box pic and a calibrated pic, but I have to have someone tell me what settings they used to get there.
Maybe since you guys test so many monitors, you could add a Calibrated settings to your display page?