Intel NUC10i7FNH Frost Canyon Review: Hexa-Core NUC Delivers a Mixed Bag
by Ganesh T S on March 2, 2020 9:00 AM ESTUL Benchmarks: PCMark and 3DMark
This section deals with a selection of the UL Futuremark benchmarks - PCMark 10, PCMark 8, and 3DMark. While the first two evaluate the system as a whole, 3DMark focuses on the graphics capabilities.
PCMark 10
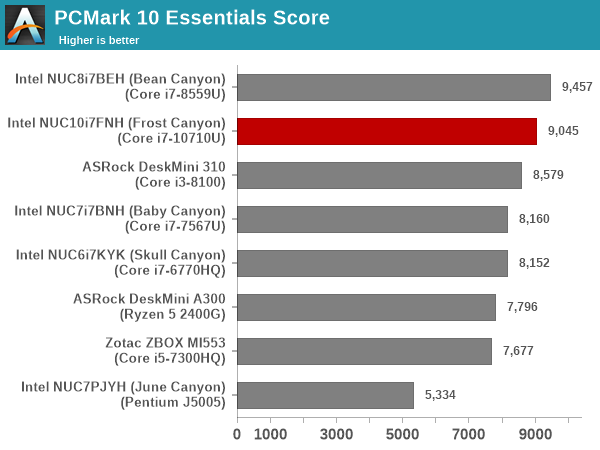
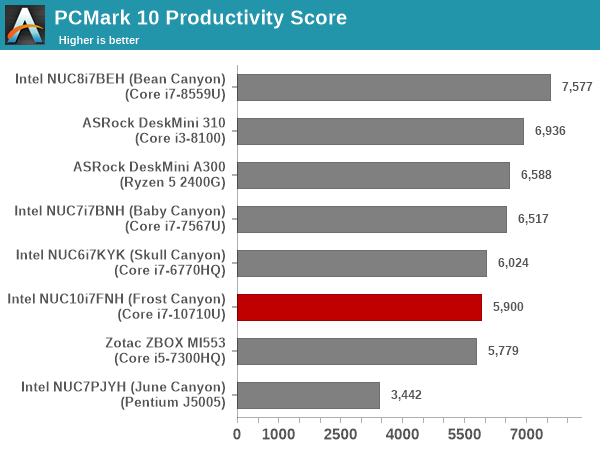
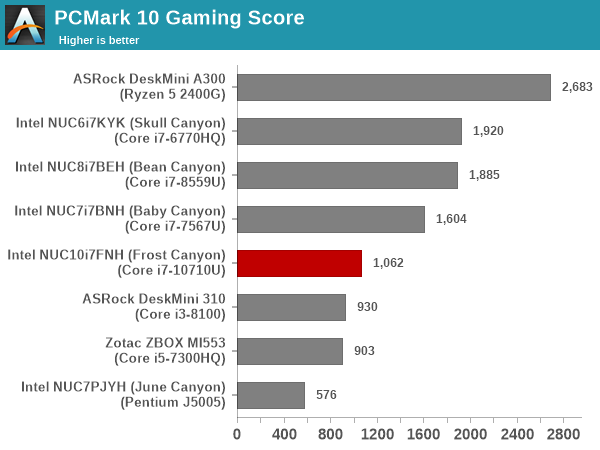
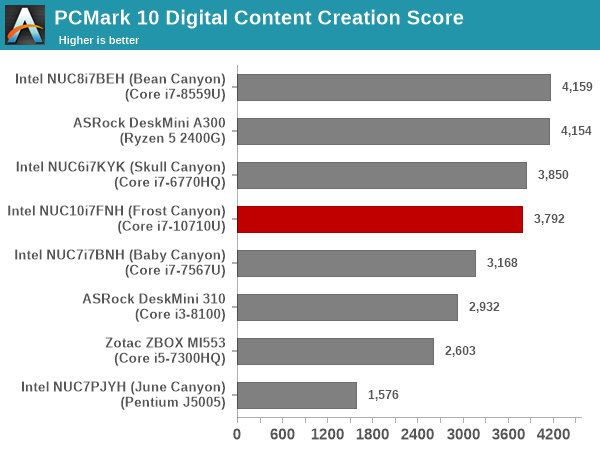
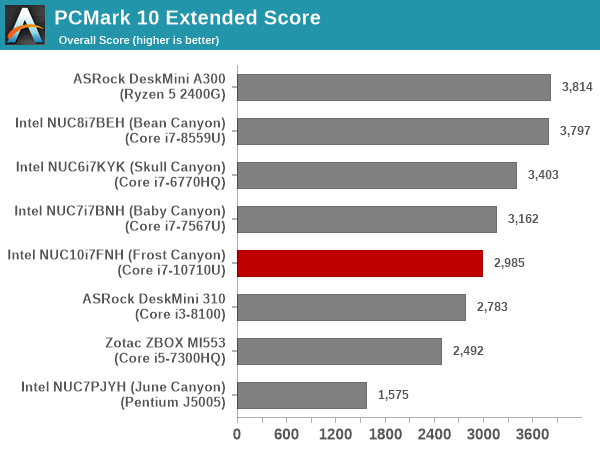
UL's PCMark 10 evaluates computing systems for various usage scenarios (generic / essential tasks such as web browsing and starting up applications, productivity tasks such as editing spreadsheets and documents, gaming, and digital content creation). We benchmarked select PCs with the PCMark 10 Extended profile and recorded the scores for various scenarios. These scores are heavily influenced by the CPU and GPU in the system, though the RAM and storage device also play a part. The power plan was set to Balanced for all the PCs while processing the PCMark 10 benchmark.
The Frost Canyon NUC comes in the middle of the pack, getting bettered by either systems with CPUs capable of higher TDP or better-performing storage. The hexa-core capabilities do not deliver any substantial benefits across various PCMark 10 scenarios, and the absence of Iris Plus Graphics / eDRAM pulls down the 'Gaming Score'.
PCMark 8
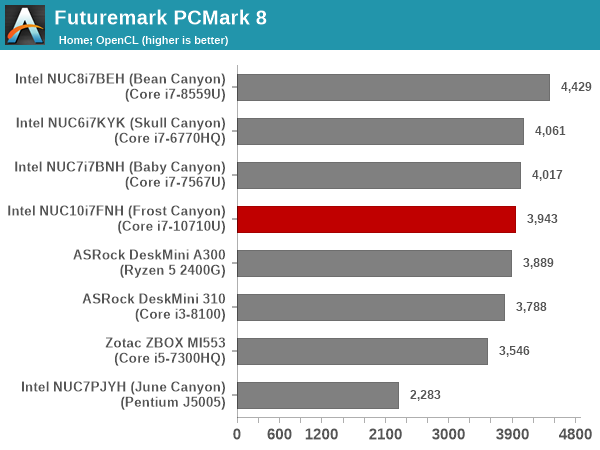
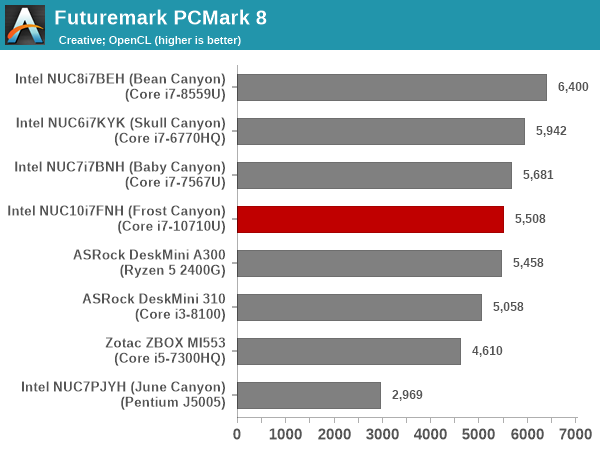
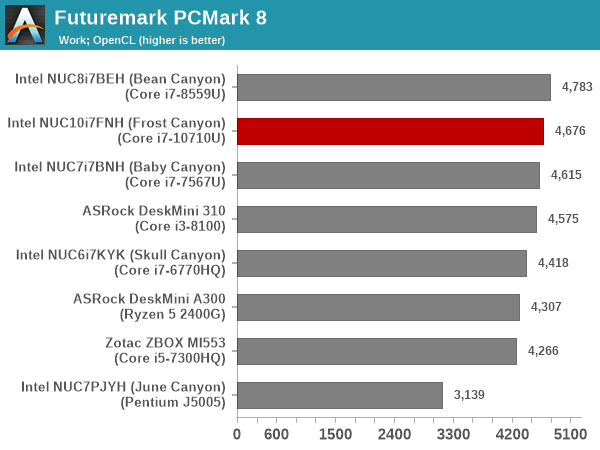
We continue to present PCMark 8 benchmark results (as those have more comparison points) while our PCMark 10 scores database for systems grows in size. PCMark 8 provides various usage scenarios (home, creative and work) and offers ways to benchmark both baseline (CPU-only) as well as OpenCL accelerated (CPU + GPU) performance. We benchmarked select PCs for the OpenCL accelerated performance in all three usage scenarios. These scores are heavily influenced by the CPU in the system, and the scores roughly track what was observed in the PCMark 10 workloads.
3DMark
UL's 3DMark comes with a diverse set of graphics workloads that target different Direct3D feature levels. Correspondingly, the rendering resolutions are also different. We use 3DMark 2.4.4264 to get an idea of the graphics capabilities of the system. In this section, we take a look at the performance of the Intel NUC10i7FNH (Frost Canyon) across the different 3DMark workloads.
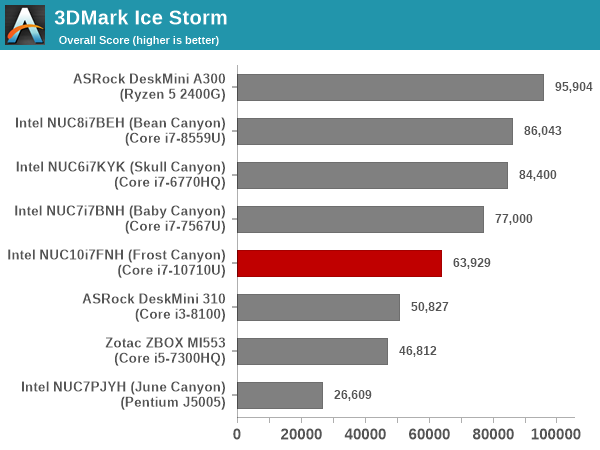
3DMark Ice Storm
This workload has three levels of varying complexity - the vanilla Ice Storm, Ice Storm Unlimited, and Ice Storm Extreme. It is a cross-platform benchmark (which means that the scores can be compared across different tablets and smartphones as well). All three use DirectX 11 (feature level 9) / OpenGL ES 2.0. While the Extreme renders at 1920 x 1080, the other two render at 1280 x 720. The graphs below present the various Ice Storm worloads' numbers for different systems that we have evaluated.
| UL 3DMark - Ice Storm Workloads | |||
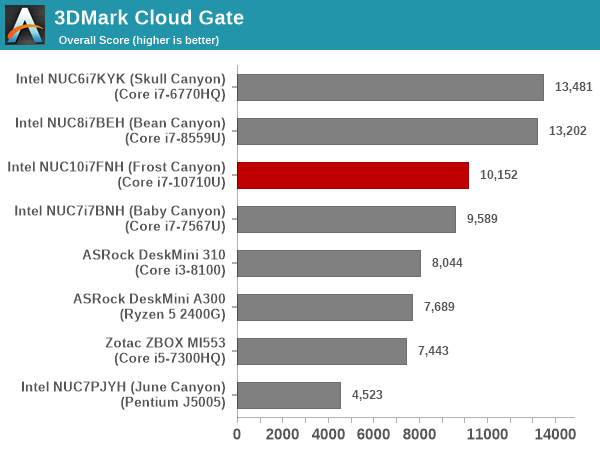
3DMark Cloud Gate
The Cloud Gate workload is meant for notebooks and typical home PCs, and uses DirectX 11 (feature level 10) to render frames at 1280 x 720. The graph below presents the overall score for the workload across all the systems that are being compared. The absence of eDRAM / Iris Plus Graphics results in the Frost Canyon performing significantly worse compared to the Bean Canyon.
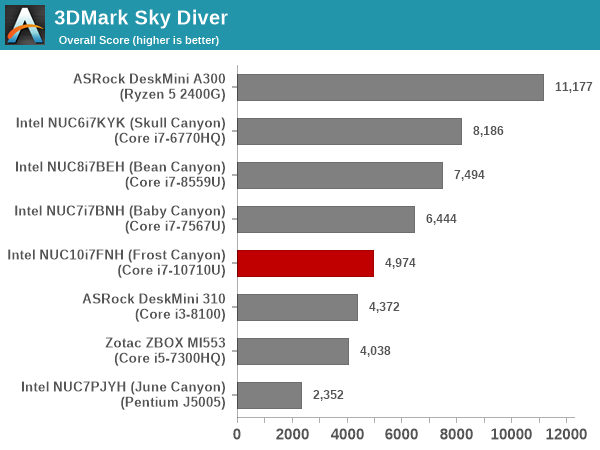
3DMark Sky Diver
The Sky Diver workload is meant for gaming notebooks and mid-range PCs, and uses DirectX 11 (feature level 11) to render frames at 1920 x 1080. The graph below presents the overall score for the workload across all the systems that are being compared. At 1080p, Frost Canyon falls further behind, and is below Baby Canyon's performance - pointing to the lack of GPU prowess.
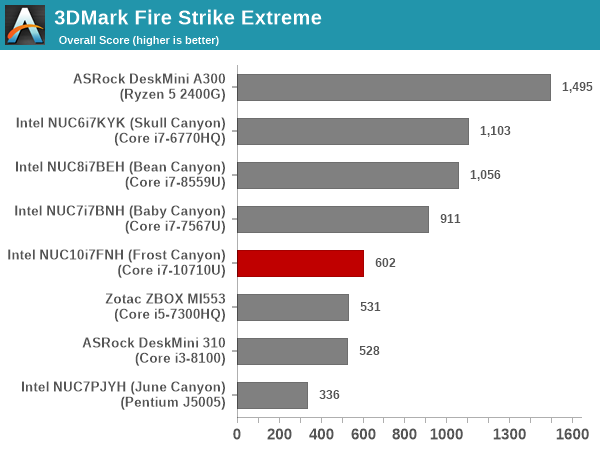
3DMark Fire Strike Extreme
The Fire Strike benchmark has three workloads. The base version is meant for high-performance gaming PCs. Similar to Sky Diver, it uses DirectX 11 (feature level 11) to render frames at 1920 x 1080. The Ultra version targets 4K gaming system, and renders at 3840 x 2160. However, we only deal with the Extreme version in our benchmarking - It renders at 2560 x 1440, and targets multi-GPU systems and overclocked PCs. The graph below presents the overall score for the Fire Strike Extreme benchmark across all the systems that are being compared. The results are similar to the Sky Diver workload.
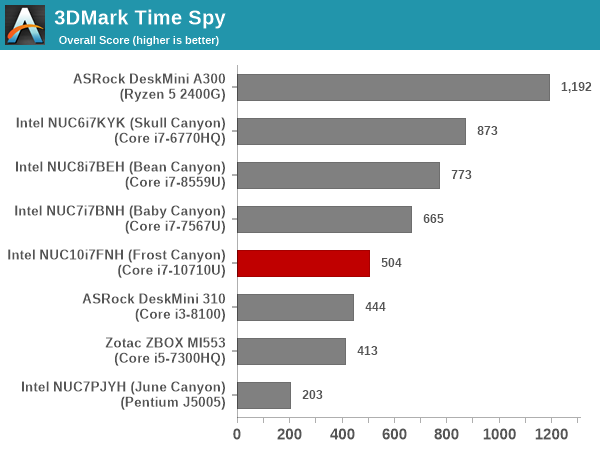
3DMark Time Spy
The Time Spy workload has two levels with different complexities. Both use DirectX 12 (feature level 11). However, the plain version targets high-performance gaming PCs with a 2560 x 1440 render resolution, while the Extreme version renders at 3840 x 2160 resolution. The graphs below present both numbers for all the systems that are being compared in this review, with results being similar to the 1080p Sky Diver workload.
| UL 3DMark - Time Spy Workloads | |||
3DMark Night Raid
The Night Raid workload is a DirectX 12 benchmark test. It is less demanding than Time Spy, and is optimized for integrated graphics. The graph below presents the overall score in this workload for different system configurations.
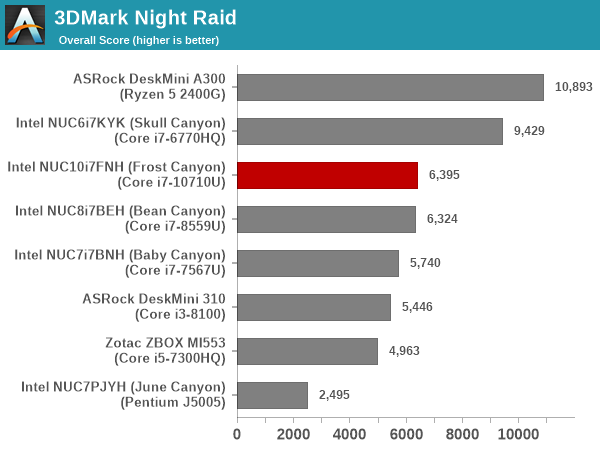
Overall, for CPU-bound graphics workloads, the Frost Canyon performs well, but, in other cases, the absence of eDRAM and the need to share the TDP with a hexa-core CPU block shows its effects. In almost all cases, the Bean Canyon NUC either vastly overperforms the Frost Canyon NUC, or, is neck-to-neck with it.


85 Comments
View All Comments
YB1064 - Monday, March 2, 2020 - link
In the temperature charts (thermal performance page), the green graph shows huge temperature spikes (~ 20 C, Furmark). Is this real? The package graph is less noisy. How are you measuring this?ganeshts - Monday, March 2, 2020 - link
All parameters are recorded using HWiNFO. We have been using the program since 2013 for recording the sensor values in all our SFF PC reviews.abqnm - Monday, March 2, 2020 - link
"A new set of value-added features include the ability to configure a RAM disk in the BIOS, mount iSCSI volumes prior to boot, and set up various network interface characteristics."These are all actually possible in the NUC8 visual bios too, though the settings are a lot harder to find, buried in the boot tab.
Ratman6161 - Monday, March 2, 2020 - link
This system isn't making a lot of sense to me from a price/performance standpoint. $605 for a bare bones? $940 as configured? Yikes!.One of the things I noticed is that there were a lot of benchmarks where the Asrock mini with the i3-8100 did pretty well against the i7 "u" cpu's. Particularly for just a standard office sort of machine, which is what I have
in mind, the i3 performs just about as well and definitely well into the more than good enough range. Of course the i3-8100 will use more juice but its also way cheaper. I just had to satisfy my curiosity so I priced out a system. The Asrock mini with an i3-9100 (vs the 8100 in the review), 16 GB DDR4, 500 GB Samsung 970 Evo (previous gen without the + to save a few bucks) and a Noctua low profile cooler for a grand total of $465.00. I've got plenty of decommissioned 2.5 inch disk drives if I need to expand. Or if I want to cheap out completely, I could use an old 2.5 inch 850 EVO 256 GB I've got laying around which would bring the price down to $375.00.
If I really wanted more CPU power, the mini would actually take an i7-9700K which would be +$275 from my local Microcenter and take the $465 configuration up to $740...still $200 under the NUC. Or a more reasonable for this system i5-9400 would add just +$65 to $530 total.
So, keeping in mind that graphics don't matter for my usage and neither does the power savings of the "U" cpu's, I just can't see the reviewed system as a viable option
Holliday75 - Monday, March 2, 2020 - link
I need 10k of them to install at buildings across the country. How soon can you build these and deliver?Holliday75 - Monday, March 2, 2020 - link
EDIT: Oh and I need ongoing hardware and kernel level support for the next 5 years with an option to extend that to 7 if needed. We boot a custom Linux image via PXE and this image changes on a regular basis along with our network infrastructure that serves it.PeachNCream - Monday, March 2, 2020 - link
I get teh point you are making, but there are also other mass-produced options other than NUC systems. Yes they are sometimes physically larger, but a SFF Dell or HP box may cost somewhat less in a bulk buy than a NUC with comparable compute power. If you need 10k fixed location systems, that would be where I would turn first rather than NUCs and certainly not use DIY builds.sandtitz - Monday, March 2, 2020 - link
That'll take about 3-4 months since Intel can't provide the CPUs...Ratman6161 - Tuesday, March 3, 2020 - link
"I need 10k of them to install at buildings across the country. "So? You have a different need than me. I just need one :). If you need them mass produced all the major manufacturers build something that's in this general size range with many different options for CPU, RAM, storage etc.
But my main point still holds. There are options for PC's that are both cheaper and more powerful than the NUC.
Irata - Monday, March 2, 2020 - link
You guys are still using Bapco benchmarks? Really?