The Samsung 860 QVO (1TB, 4TB) SSD Review: First Consumer SATA QLC
by Billy Tallis on November 27, 2018 11:20 AM ESTWhole-Drive Fill: Testing SLC Cache Size
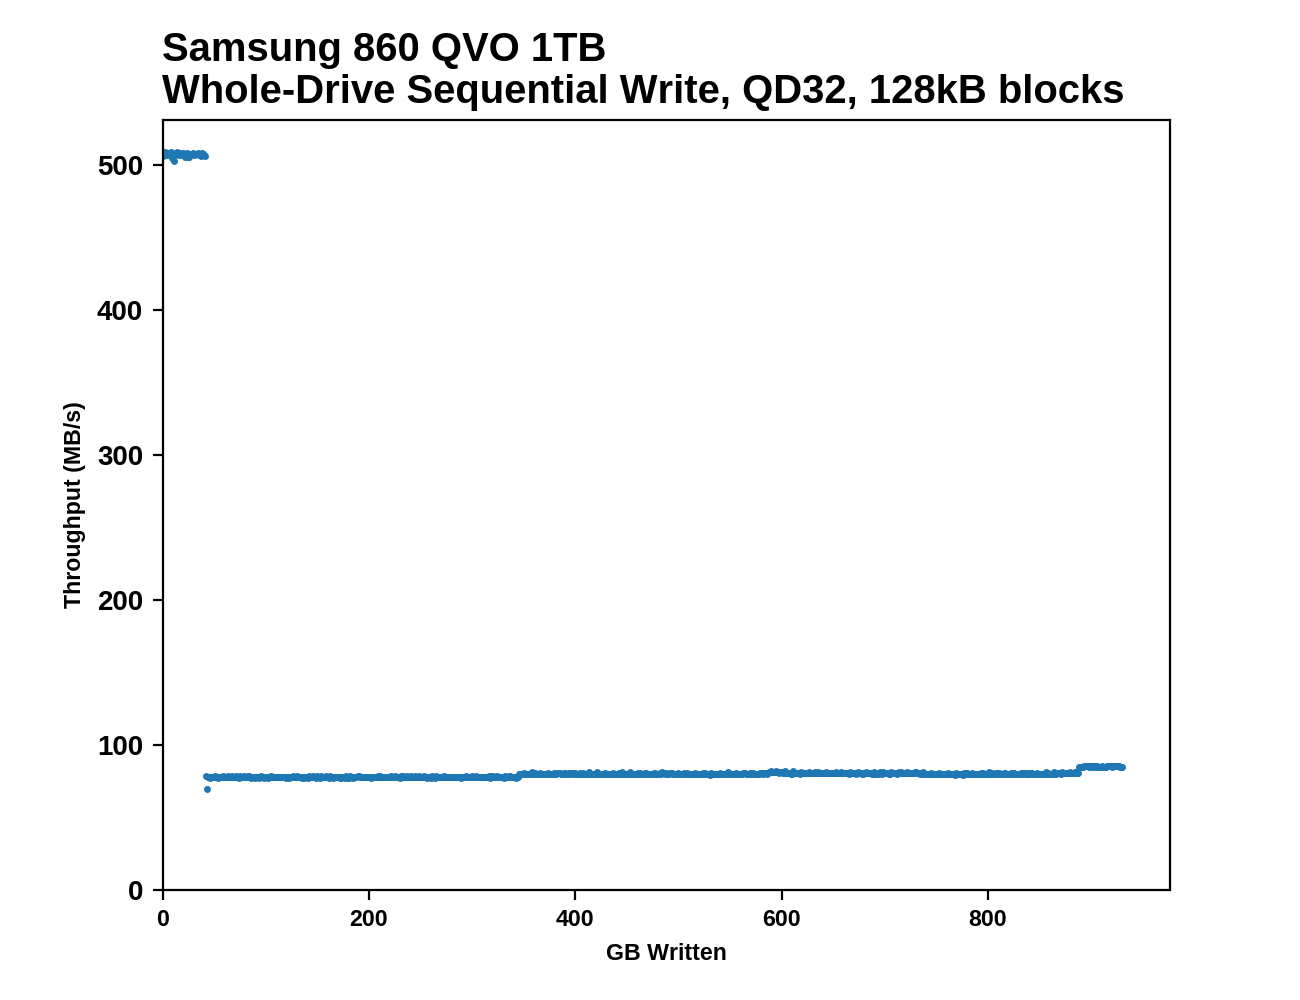
This test starts with a freshly-erased drive and fills it with 128kB sequential writes at queue depth 32, recording the write speed for each 1GB segment. This test is not representative of any ordinary client/consumer usage pattern, but it does allow us to observe transitions in the drive's behavior as it fills up. This can allow us to estimate the size of any SLC write cache, and get a sense for how much performance remains on the rare occasions where real-world usage keeps writing data after filling the cache. Samsung's official specifications are:
| Samsung 860 QVO Secondary Specifications | |||||
| Capacity | 1 TB | 2 TB | 4 TB | ||
| SLC Cache Size |
Min | 6 GB | 6 GB | 6 GB | |
| Max | 42 GB | 78 GB | 78 GB | ||
| Sequential Write |
SLC Cache | 520 MB/s | |||
| QLC | 80 MB/s | 160 MB/s | 160 MB/s | ||
Our results show the following:
 |
|||||||||
The Samsung 860 QVOs run out of SLC cache right on schedule, at 42 GB for the 1TB model and 78 GB for the 4TB. After that, they are both slow and very steady for the rest of the test.
 |
|||||||||
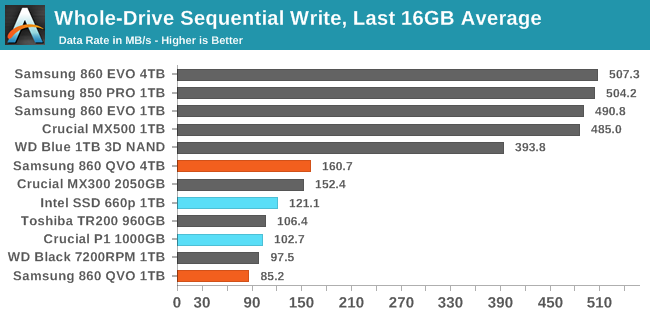
| Average Throughput for last 16 GB | Overall Average Throughput | ||||||||
The 1TB 860 QVO falls below the sequential write speed of a 1TB hard drive once the SLC cache runs out, but the 4TB model is able to sustain twice the write speed and remains ahead of not just the hard drive's speed, but also some of the slower TLC drives.
BAPCo SYSmark 2018
BAPCo's SYSmark 2018 is an application-based benchmark that uses real-world applications to replay usage patterns of business users, with subscores for productivity, creativity and responsiveness. Scores represnt overall system performance and are calibrated against a reference system that is defined to score 1000 in each of the scenarios. A score of, say, 2000, would imply that the system under test is twice as fast as the reference system.
SYSmark scores are based on total application response time as seen by the user, including not only storage latency but time spent by the processor. This means there's a limit to how much a storage improvement could possibly increase scores, because the SSD is only in use for a small fraction of the total test duration. This is a significant difference from our ATSB tests where only the storage portion of the workload is replicated and disk idle times are cut short to a maximum of 25ms.
| AnandTech SYSmark SSD Testbed | |
| CPU | Intel Core i5-7400 |
| Motherboard | ASUS PRIME Z270-A |
| Chipset | Intel Z270 |
| Memory | 2x 8GB Corsair Vengeance DDR4-2400 CL17 |
| Case | In Win C583 |
| Power Supply | Cooler Master G550M |
| OS | Windows 10 64-bit, version 1803 |
Our SSD testing with SYSmark uses a different test system than the rest of our SSD tests. This machine is set up to measure total system power consumption rather than just the drive's power.
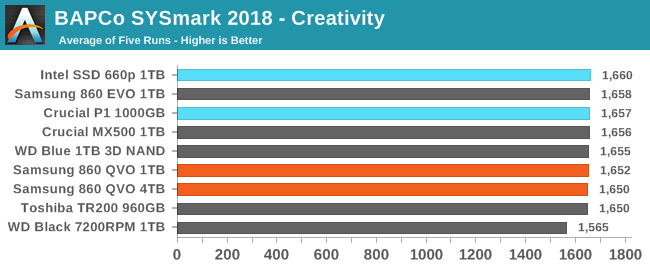
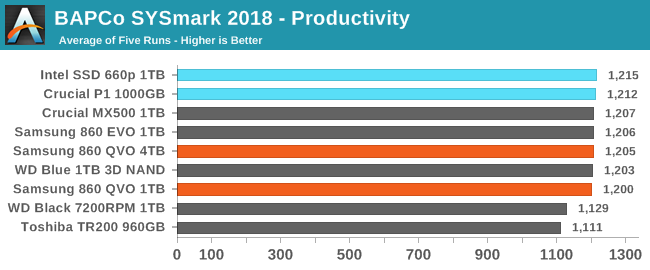
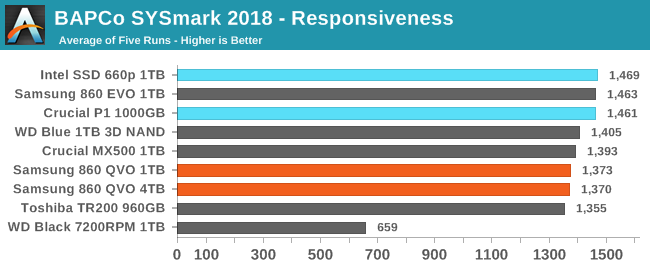
The 860 QVO isn't any slower for compute-heavy interactive tasks than the mainstream SATA SSDs, and even on the more I/O-bound Responsiveness test the 860 QVO is ahead of the DRAMless TLC drive and not far behind the Crucial MX500.
Energy Use
The SYSmark energy usage scores measure total system power consumption, excluding the display. Our SYSmark test system idles at around 26 W and peaks at over 60 W measured at the wall during the benchmark run. SATA SSDs seldom exceed 5 W and idle at a fraction of a watt, and the SSDs spend most of the test idle. This means the energy usage scores will inevitably be very close. A typical notebook system will tend to be better optimized for power efficiency than this desktop system, so the SSD would account for a much larger portion of the total and the score difference between SSDs would be more noticeable.
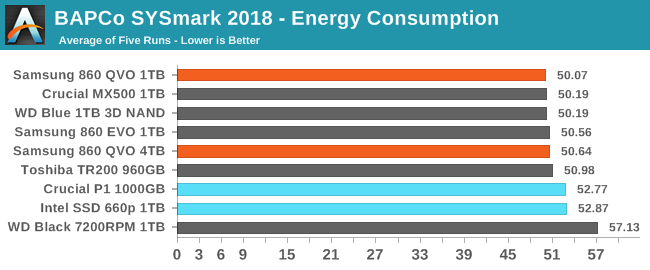
The Samsung 860 QVO's energy usage during SYSmark is not a problem at all, with it using slightly less energy than the mainstream SATA TLC drives.


109 Comments
View All Comments
Santoval - Wednesday, November 28, 2018 - link
"Right now there is exactly zero reason to choose it over the EVO. The 500GB EVO costs about $130 US where I'm from, there's very little incentive for me to buy it given the "inflated" price."Assuming the 500GB EVO actually costs as much as the 1TB EVO in your country (I'm frankly skeptical about this, but let's take you at your word) what makes you thing that the 1TB QVO will not in turn cost as much as the 2TB QVO?
Are you seriously suggesting that your country's taxmen or tariffmen are going to place much lower taxes/tariffs on QLC based SSDs than one TLC based SSDs?
Lolimaster - Thursday, November 29, 2018 - link
Import the 1TB from Amazon, you can do that to any south american country.Impulses - Thursday, November 29, 2018 - link
Even at 25% cheaper than an EVO it would barely beat the (current) best sale price of other mainstream TLC SSD... And TLC is probably not going away any time soon. I'd love to see the price gap reach 25%+ sooner rather than later tho.Oxford Guy - Tuesday, November 27, 2018 - link
It may be that companies are hoping for higher margin. It is not impossible for that to happen. CDs, for example, were a higher margin product than the LPs they replaced.If supply of TLC shrinks, as companies move to QLC production, the competition between TLC and QLC also shrinks, making room, potentially, for more margin.
Amandtec - Tuesday, November 27, 2018 - link
The yields are poor at the moment so there is no point selling them low. It has a big effect on your share price if you release new game changing technology like QLC to market, because shareholders are sophisticated and understand the long term term strategy here.moozooh - Wednesday, November 28, 2018 - link
> The yields are poor at the moment so there is no point selling them low.I think you misunderstand: there's no point *buying them high*. The only point of these drives is buying them low. So not selling them low means *not selling them*, period.
Customers may not be shareholders, but they aren't idiots, either. They understand QLC is a step down in almost every aspect of the drive's operation. It's an inferior product, and the price needs to reflect that for it to be considered for purchase.
jjj - Wednesday, November 28, 2018 - link
Actually , R&D is surprisingly low compared to the revenue generated and, aside from that, they might be close enough to 5 cents per GB production costs now for QLC so if there is a global economic crash caused by Trump and his tariffs, we could see 50$ per TB in half a year from now.Otherwise, could be 2020-2021 for that kind of price, especially if China manages to ramp output.
NAND prices are down a bit from peak but folks still have 40-50% overall NAND margins,there is room for much lower prices and production costs decline 15-25% per year.
R0H1T - Wednesday, November 28, 2018 - link
>they might be close enough to 5 cents per GB production costs now for QLCSure but that's at least 6~12 months away from now. So how can anyone realistically expect Samsung to debut the QVO at such prices given there's no competition (SATA QLC) nor any reason for Samsung to not make hay while the sun shines? For anyone who says the $130 US for 1TB EVO is the normal price, it's not in the ROTW.
sonny73n - Wednesday, November 28, 2018 - link
“Yeah no one's selling you 8TB for $400 anytime soon. Aside from the fact that the R&D costs for QLC need to be recuperated first & companies need to reinvest an increasing amount for future development, there's also a point after which it doesn't make sense for the SSD, or NAND, maker to sell these at a loss.If you really want something that big, for dirt cheap, try spinners instead.”
You sound like a Samsung shill. If HDD manufacturers decide to keep on R&D for those spinners, are you willing to pay extra for their future development? Beside, SSD tech has been around for a decade, now it costs less to make an SSD than to make an HDD for the same capacity.
R0H1T - Wednesday, November 28, 2018 - link
>You sound like a Samsung shill.Oh sure let's all forget the aftermath of the Thai floods ~ insane prices, insane quality (as in really bad) w/warranties as low as just a year long! So while the HDD makers sat on their collective behind, much like Intel, the SSD makers out paced them, out innovated(?) them & could make spinners virtually obsolete, except bottom of the barrel 5400/5900 rpm drives especially in $/GB.
So let's see, arguing for higher prices because R&D is an ever increasing (one time) cost that needs to be recuperated, is shilling now? Do you also want me to feel sad because vacuum tubes are dead or that NAND prices will continue to fall, in the foreseeable future?