Intel's 10nm Cannon Lake and Core i3-8121U Deep Dive Review
by Ian Cutress on January 25, 2019 10:30 AM ESTStock CPU Performance: System Tests
Our System Test section focuses significantly on real-world testing, user experience, with a slight nod to throughput. In this section we cover application loading time, image processing, simple scientific physics, emulation, neural simulation, optimized compute, and 3D model development, with a combination of readily available and custom software. For some of these tests, the bigger suites such as PCMark do cover them (we publish those values in our office section), although multiple perspectives is always beneficial. In all our tests we will explain in-depth what is being tested, and how we are testing.
All of our benchmark results can also be found in our benchmark engine, Bench.
Application Load: GIMP 2.10.4
One of the most important aspects about user experience and workflow is how fast does a system respond. A good test of this is to see how long it takes for an application to load. Most applications these days, when on an SSD, load fairly instantly, however some office tools require asset pre-loading before being available. Most operating systems employ caching as well, so when certain software is loaded repeatedly (web browser, office tools), then can be initialized much quicker.
In our last suite, we tested how long it took to load a large PDF in Adobe Acrobat. Unfortunately this test was a nightmare to program for, and didn’t transfer over to Win10 RS3 easily. In the meantime we discovered an application that can automate this test, and we put it up against GIMP, a popular free open-source online photo editing tool, and the major alternative to Adobe Photoshop. We set it to load a large 50MB design template, and perform the load 10 times with 10 seconds in-between each. Due to caching, the first 3-5 results are often slower than the rest, and time to cache can be inconsistent, we take the average of the last five results to show CPU processing on cached loading.
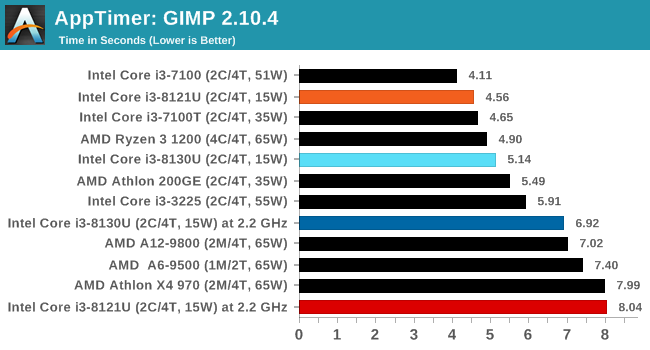
The CNL platform here does particularly well in loading software, which correlates with what I felt actually using the system - it felt faster than some Core i7 notebooks I've used. This might be down to the GPU acting on the display however. But it doesn't explain the extreme regression when we fix the clock speed.
FCAT: Image Processing
The FCAT software was developed to help detect microstuttering, dropped frames, and run frames in graphics benchmarks when two accelerators were paired together to render a scene. Due to game engines and graphics drivers, not all GPU combinations performed ideally, which led to this software fixing colors to each rendered frame and dynamic raw recording of the data using a video capture device.

The FCAT software takes that recorded video, which in our case is 90 seconds of a 1440p run of Rise of the Tomb Raider, and processes that color data into frame time data so the system can plot an ‘observed’ frame rate, and correlate that to the power consumption of the accelerators. This test, by virtue of how quickly it was put together, is single threaded. We run the process and report the time to completion.
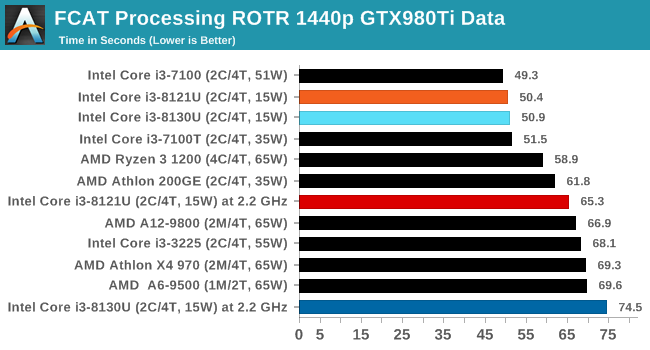
At stock speeds, both of our CNL and KBL chips score within half a second of each other. At fixed frequency, CNL comes out slightly ahead.
3D Particle Movement v2.1: Brownian Motion
Our 3DPM test is a custom built benchmark designed to simulate six different particle movement algorithms of points in a 3D space. The algorithms were developed as part of my PhD., and while ultimately perform best on a GPU, provide a good idea on how instruction streams are interpreted by different microarchitectures.
A key part of the algorithms is the random number generation – we use relatively fast generation which ends up implementing dependency chains in the code. The upgrade over the naïve first version of this code solved for false sharing in the caches, a major bottleneck. We are also looking at AVX2 and AVX512 versions of this benchmark for future reviews.
For this test, we run a stock particle set over the six algorithms for 20 seconds apiece, with 10 second pauses, and report the total rate of particle movement, in millions of operations (movements) per second. We have a non-AVX version and an AVX version, with the latter implementing AVX512 and AVX2 where possible.
3DPM v2.1 can be downloaded from our server: 3DPMv2.1.rar (13.0 MB)
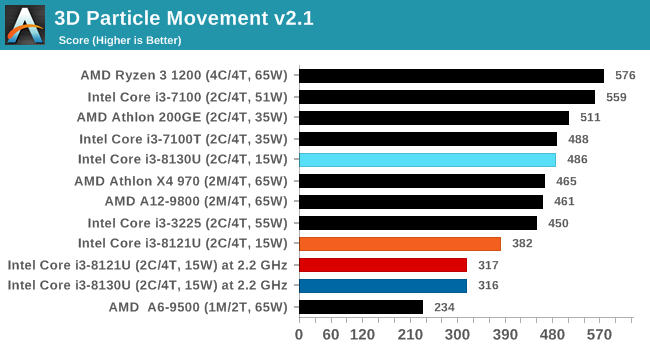
When AVX isn't on show, the KBL processor takes a lead, however it is worth nothing that at fixed frequency both CNL and KBL perform essentially the same.
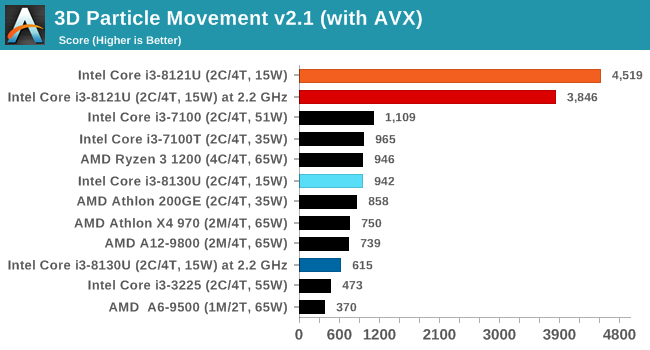
When we crank on the AVX2 and AVX512, there is no stopping the Cannon Lake chip here. At a score of 4519, it beats a full 18-core Core i9-7980XE processor running in non-AVX mode which scores 4185. That's insane. Truly a big plus in Cannon Lake's favor.
Dolphin 5.0: Console Emulation
One of the popular requested tests in our suite is to do with console emulation. Being able to pick up a game from an older system and run it as expected depends on the overhead of the emulator: it takes a significantly more powerful x86 system to be able to accurately emulate an older non-x86 console, especially if code for that console was made to abuse certain physical bugs in the hardware.
For our test, we use the popular Dolphin emulation software, and run a compute project through it to determine how close to a standard console system our processors can emulate. In this test, a Nintendo Wii would take around 1050 seconds.
The latest version of Dolphin can be downloaded from https://dolphin-emu.org/
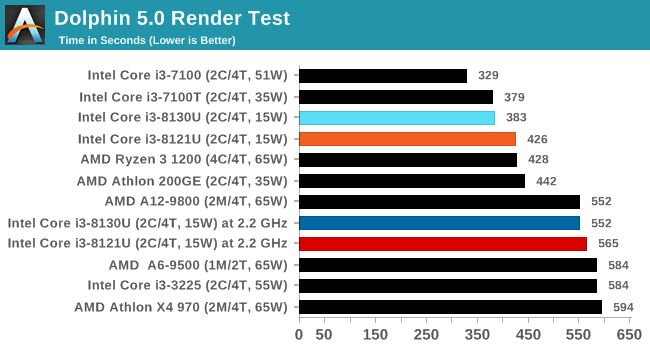
Both CPUs perform roughly the same at fixed frequency, however KBL has a slight lead at stock frequencies, likely due to its extra 200 MHz and ability to keep that frequency regardless of what's running in the background.
DigiCortex 1.20: Sea Slug Brain Simulation
This benchmark was originally designed for simulation and visualization of neuron and synapse activity, as is commonly found in the brain. The software comes with a variety of benchmark modes, and we take the small benchmark which runs a 32k neuron / 1.8B synapse simulation, equivalent to a Sea Slug.

Example of a 2.1B neuron simulation
We report the results as the ability to simulate the data as a fraction of real-time, so anything above a ‘one’ is suitable for real-time work. Out of the two modes, a ‘non-firing’ mode which is DRAM heavy and a ‘firing’ mode which has CPU work, we choose the latter. Despite this, the benchmark is still affected by DRAM speed a fair amount.
DigiCortex can be downloaded from http://www.digicortex.net/
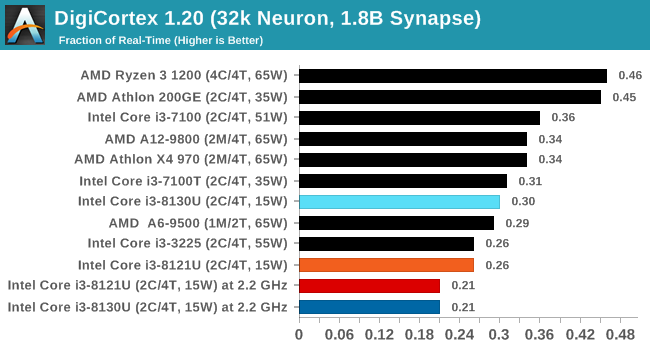
At a fixed frequency, both processors perform the same, but at stock frequencies the lower DRAM latency means that the Cannon Lake CPU only improves a little bit, whereas the Kaby Lake adds another 50% performance.
y-Cruncher v0.7.6: Microarchitecture Optimized Compute
I’ve known about y-Cruncher for a while, as a tool to help compute various mathematical constants, but it wasn’t until I began talking with its developer, Alex Yee, a researcher from NWU and now software optimization developer, that I realized that he has optimized the software like crazy to get the best performance. Naturally, any simulation that can take 20+ days can benefit from a 1% performance increase! Alex started y-cruncher as a high-school project, but it is now at a state where Alex is keeping it up to date to take advantage of the latest instruction sets before they are even made available in hardware.
For our test we run y-cruncher v0.7.6 through all the different optimized variants of the binary, single threaded and multi-threaded, including the AVX-512 optimized binaries. The test is to calculate 250m digits of Pi, and we use the single threaded and multi-threaded versions of this test.
Users can download y-cruncher from Alex’s website: http://www.numberworld.org/y-cruncher/
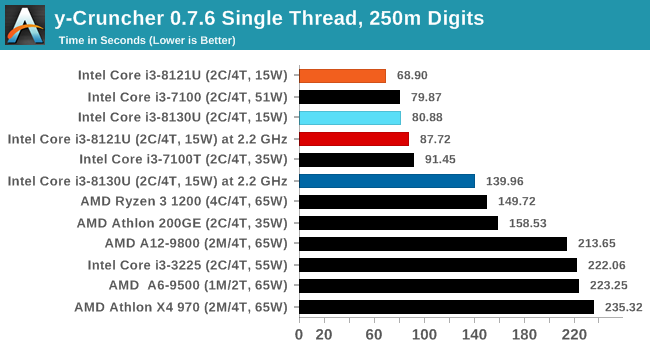
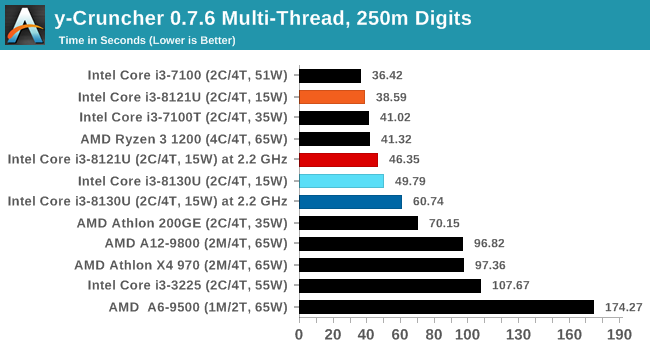
y-Cruncher is another AVX-512 test, and in both ST and MT modes, Cannon Lake wins. Interestingly in MT mode, CNL at 2.2 GHz scores better than KBL at stock frequencies.
Agisoft Photoscan 1.3.3: 2D Image to 3D Model Conversion
One of the ISVs that we have worked with for a number of years is Agisoft, who develop software called PhotoScan that transforms a number of 2D images into a 3D model. This is an important tool in model development and archiving, and relies on a number of single threaded and multi-threaded algorithms to go from one side of the computation to the other.
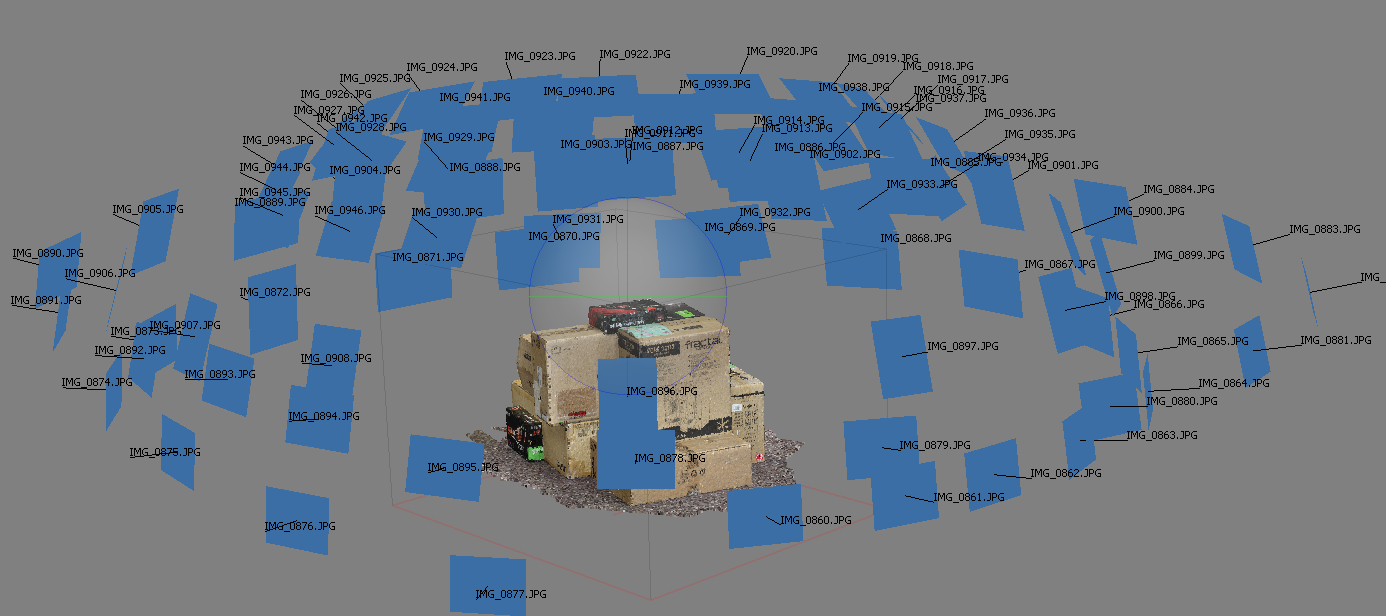
In our test, we take v1.3.3 of the software with a good sized data set of 84 x 18 megapixel photos and push it through a reasonably fast variant of the algorithms, but is still more stringent than our 2017 test. We report the total time to complete the process.
Agisoft’s Photoscan website can be found here: http://www.agisoft.com/
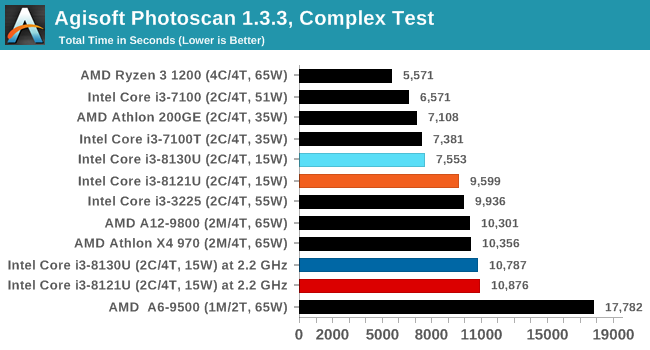
KBL takes a big lead here at stock frequencies, while at fixed frequencies the results are similar. We might be coming up against the power difference here - the KBL system has a higher steady state power limit.


129 Comments
View All Comments
qcmadness - Saturday, January 26, 2019 - link
I am more curious on the manufacturing node. Zen (14 / 12nm from GF) has 12 metal layers. Cannon Lake has 13 metal layers, with 3 quad-patterning and 2 dual patterning. How would these impact the yield and manufacturing time of production? I think the 3 quad-patterning process will hurt Intel in the long run.KOneJ - Sunday, January 27, 2019 - link
More short-run I would say actually. EUV is coming to simplify and homogenize matters. This is a patch job. Unfortunately, PL analysis and comparison is not an apples-to-apples issue as there are so many facets to implementation in various design stages. A broader perspective that encompasses the overall aspects and characteristics is more relevant IMHO. It's like comparing a high-pressure FI SOHC motor with a totally unrelated low-pressure FI electrically-spooling DOHC motor of similar displacement. While arguing minutiae about design choices is interesting to satisfy academic curiosity, it's ultimately the reliability, power-curve and efficiency that people care about. Processors are much the same. As a side note, I think it's the attention to all these facets and stages that has given Jim Keller such consistent success. Intel's shaping up for a promising long-term. The only question there is where RISC designs and AMD will be when the time comes. HSA is coming, but it will be difficult due to the inherent programming challenges. Am curious to see where things are in ten or fifteen years.eastcoast_pete - Sunday, January 27, 2019 - link
Good point and question! With the GPU functions apparently simply not compatible with Intel's 10 nm process, does anyone here know if any GPUs out there that use quad-patterning at all?anonomouse - Sunday, January 27, 2019 - link
@Ian or @Andrei Is dealII missing from the spec2006fp results table for some reason? Is this just a typo/oversight, or is there some reason it's being omitted?KOneJ - Sunday, January 27, 2019 - link
Great write up, but isn't this backwards on the third page?"a 2-input NAND logic cell is much smaller than a complex scan flip-flop logic cell"
"90.78 MTr/mm^2 for NAND2 gates and 115.74 MTr/mm^2 for Scan Flip Flops"
NAND cell is smaller than flip-flop cell, but there is more flip-flop than NAND in a square millimeter?
Or am I missing something?
Rudde - Sunday, January 27, 2019 - link
A NAND logic cell consists of 2 transistors, while a Scan flip flop logic cell can consist of different count of transistors depending on where it is used. If I remeber correctly, Intel uses 8, 10 and 12 transistor designs.That gives 45.39 million NAND cells per mm² (basically SRAM) and ~12 million flip-flop cells.
The NAND cell is smaller because it consists of fewer transistors.
KOneJ - Sunday, January 27, 2019 - link
It would be great if you guys could get a CNL sample in the hands of Agner Fog. He might be able to answer some of the micro-architecture questions through his tests.dragosmp - Sunday, January 27, 2019 - link
Awesome review, great in depth content and well explained. Considering the amount of work this entailed, it's clear why these reviews don't happen every day. Thanksdragosmp - Sunday, January 27, 2019 - link
I'll just add...many folks are saying AMD should kick arse. They should, but Intel has been in this situation before - they had messed up the 90nm process; probably not quite as bad as the chips to be unusable, but it opened the door to AMD and its Athlon 64. What did AMD do? Messed it up in turn with slow development and poor design choices. Hopefully they'll capitalize this time so that we get an actual dupoloy, rather than the monopoly on performance we had since Intel's 65nm chips.eva02langley - Sunday, January 27, 2019 - link
Euh... You mean this...?https://www.youtube.com/watch?v=osSMJRyxG0k
Anti-competitive tactics? They bought the OEM support to prevent competition.
And, all lately, this came up...
https://www.tomshardware.com/news/msi-ceo-intervie...
"Relationship with Intel: Chiang told us that, given Intel's strong support during the shortage, it would be awkward to tell Intel if he chose to come out with an AMD-powered product. "It's very hard for us to tell them 'hey, we don't want to use 100 percent Intel,' because they give us very good support," he said. He did not, however, make any claims that Intel had pressured him or the company."
Yeah right, Intel is winning because they have better tech... /sarcasm