A Look at Enterprise Performance of Intel SSDs
by Anand Lal Shimpi on February 8, 2012 6:36 PM EST- Posted in
- Storage
- IT Computing
- SSDs
- Intel
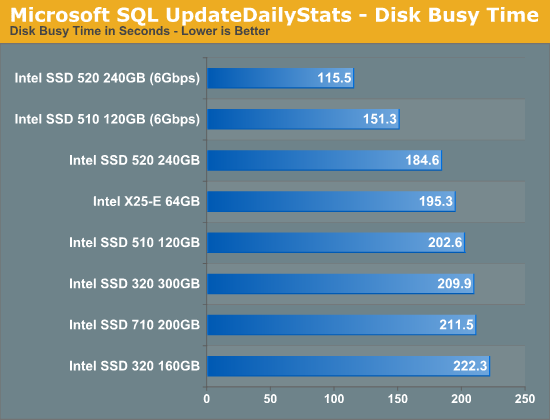
Enterprise Storage Bench - Microsoft SQL UpdateDailyStats
Our next two tests are taken from our own internal infrastructure. We do a lot of statistics tracking at AnandTech - we record traffic data to all articles as well as aggregate traffic for the entire site (including forums) on a daily basis. We also keep track of a running total of traffic for the month. Our first benchmark is a trace of the MS SQL process that does all of the daily and monthly stats processing for the site. We run this process once a day as it puts a fairly high load on our DB server. Then again, we don't have a beefy SSD array in there yet :)
The UpdateDailyStats procedure is mostly reads (3:1 ratio of GB reads to writes) with 431K read operations and 179K write ops. Average queue depth is 4.2 and only 34% of all IOs are issued at a queue depth of 1. The transfer size breakdown is as follows:
| AnandTech Enterprise Storage Bench MS SQL UpdateDaily Stats IO Breakdown | ||||
| IO Size | % of Total | |||
| 8KB | 21% | |||
| 64KB | 35% | |||
| 128KB | 35% | |||
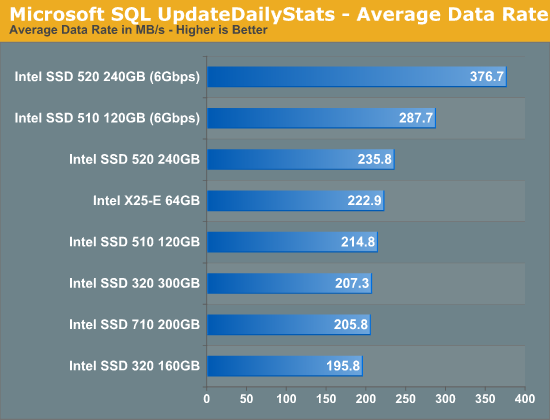
Our SQL tests are much more dependent on sequential throughput and thus we really see some impressive gains from moving to a 6Gbps SATA interface. Among the 3Gbps results the Intel SSD 520 is now the top performer, followed once again by the X25-E. To be honest, most of these drives do perform the same as they bump into the limits of 3Gbps SATA.
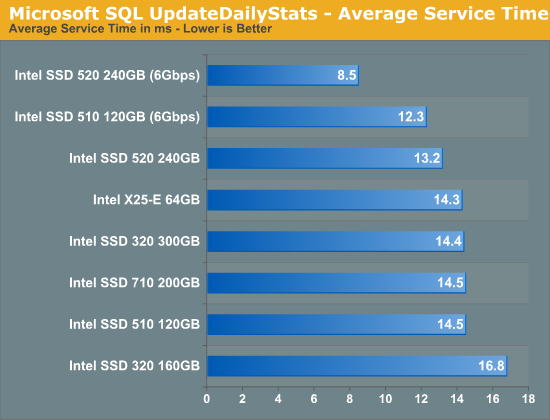
Once again we see a huge reduction in service time from the Intel SSD 520 running on a 6Gbps interface. Even on a 3Gbps interface the 520 takes the lead while the bulk of the 3Gbps drives cluster together around 14.4ms. Note the tangible difference in performance between the 300GB and 160GB Intel SSD 320. The gap isn't purely because of additional NAND parallelism, the 300GB drive ends up with more effective spare area since the workload size doesn't scale up with drive capacity. What you're looking at here is the impact of spare area on performance.


55 Comments
View All Comments
jeremyshaw - Wednesday, February 8, 2012 - link
woah... I've been waiting for an article like this for a long time.Thank you Anandtech!
ckryan - Wednesday, February 8, 2012 - link
Is AnandTech ever planning on doing a longer period SSD test? A long term testing scenario would make for interesting reading.Anand Lal Shimpi - Wednesday, February 8, 2012 - link
Technically all of our SSD tests are long term. We're still testing Vertex 2 class drives and I actually still have six Intel X25-M G1s deployed in systems in my lab alone. You only hear about them when things go wrong. Most of the time I feed errors back to the vendors to get fixes put into firmware updates. The fact that you aren't seeing more of this sort of stuff means that things are working well :-PBut the results of our long term tests directly impact our reviews/recommendations. It's one of the reasons I've been so positive on the Samsung SSD 830 lately. I've been using 830s 24/7 since our review published in September with very good results :)
Take care,
Anand
Samus - Thursday, February 9, 2012 - link
I've had an X25-M G1 in my Macbook since 2009, used daily, never a problem. Lack of trim support doesn't really seem to matter unless you're the type the writes/deletes a lot of data.jwilliams4200 - Wednesday, February 8, 2012 - link
Since you found that the 520 does not really do any better than the 320 for endurance, does this also imply that the Sandforce controller was not able to achieve significant compression on the workload that you fed to it? In other words, Sandforce compression does not work very well on real data as opposed to artificial benchmark data.ckryan - Wednesday, February 8, 2012 - link
SF is really good at compressing fake data. I suppose some logs could really benefit, but one of my personal SF drives has 10% more raw writes than host writes. I suspect I'm not alone with this either.People doing repeated incompressible benches could have WA higher than 1 with SF, but once you install the OS and and programs, every day writes are less compressible than promised it would seem.
Anand Lal Shimpi - Wednesday, February 8, 2012 - link
Keep in mind that only 10% more NAND writes than host writes is *really* good. It's not uncommon to get much, much higher than that with other controllers.We did an 8 month study on SF drives internally. The highest write amp we saw was 0.7x. On my personal drive I saw a write amp of around 0.6x.
Take care,
Anand
jwilliams4200 - Thursday, February 9, 2012 - link
Baloney!You just saw a write amplification of near 1 on this very article. Why do you dodge my question?
erple2 - Thursday, February 9, 2012 - link
I suspect that the workloads that they were testing for with the SF drives internally are not what is reflected in this article.That implies, then, that the SF drives have been doing other workloads like acting in desktops and/or laptop duties. For those kinds of things, I suspect that a 0.6-0.7x is more reasonable (assuming there isn't much reading/writing of incompressible data).
Given that some of the workload may be for mobile applications, and given a strong focus on WDE for laptops, I wonder how that ultimately impacts the write amplification for drives with WDE on them.
jwilliams4200 - Thursday, February 9, 2012 - link
The "8 month study" that he refers to is very hard to believe.Does he really expect us to believe that the people in Anand's test lab used these SSDs for 8 months and did not run any benchmarks on them?
Most benchmarks write easily compressible data, and a lot of it.
The real way to test the Sandforce compression is to write typical user data to the SSD and monitor the raw write and host write attributes. That experiment has already been done on xtremesystems.org, and the findings were that typical user data bare compresses at all -- at best raw writes were 90% of host writes, but for most data it was 100% or higher. The only thing that got some compression was the OS and application installs, and most people only do those once, so it should not be counted towards user data when estimating endurance.