Analyzing Intel Core M Performance: How 5Y10 can beat 5Y71 & the OEMs' Dilemma
by Brett Howse & Ian Cutress on April 8, 2015 8:00 AM EST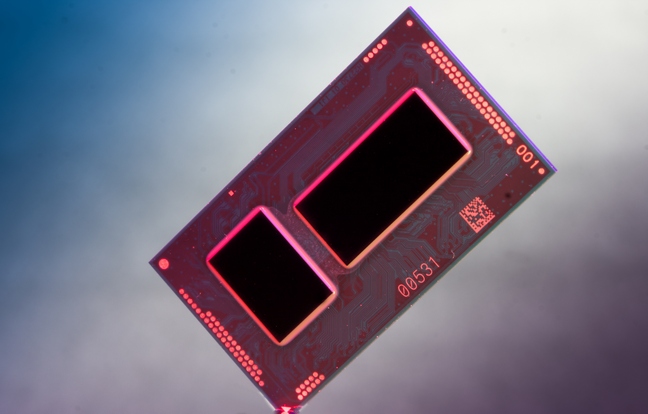
A processor architect can battle between two major opposing principles. The one most of us seem to enjoy is performance, which when taken to the extreme exhibits an all-or-nothing approach. At the other end is low-power operation which has become the main focus of the laptop and notebook market where battery capacity and density is at a premium. The position in the middle of this is efficiency, trying to extract the best of performance and power consumption and provide a product at the end of the day which attempts to satisfy both.
Of course processor architects only have control up to the point where the chips leave the fab, at which point the final product design is in the hands of OEMs, who for various reasons will have their own product design goals. It's this latter point that has resulted in an interesting situation developing around the Core M ecosystem, where due to OEM design goals we've seen the relative performance of Core M devices vary much more than usual. In our tests of some of the Core M notebooks since the beginning of the year, depending on the complexity of the test, the length of time it is running and the device it is in, we have seen cases where devices equipped with the lowest speed grades of the Core M processor are outperforming the highest speed grade processors in similar types of devices, an at-times surprising outcome to say the least.
Never content to leave things alone, we wanted to take a look at the performance in Core M in depth and how device design - particularly cooling design - can significantly impact performance. So for today we will be diving deep into Core M, to see what we can test and what can be said about system design as a whole for the mini-PC, notebook, tablet and 2-in-1 ecosystem.
Core M
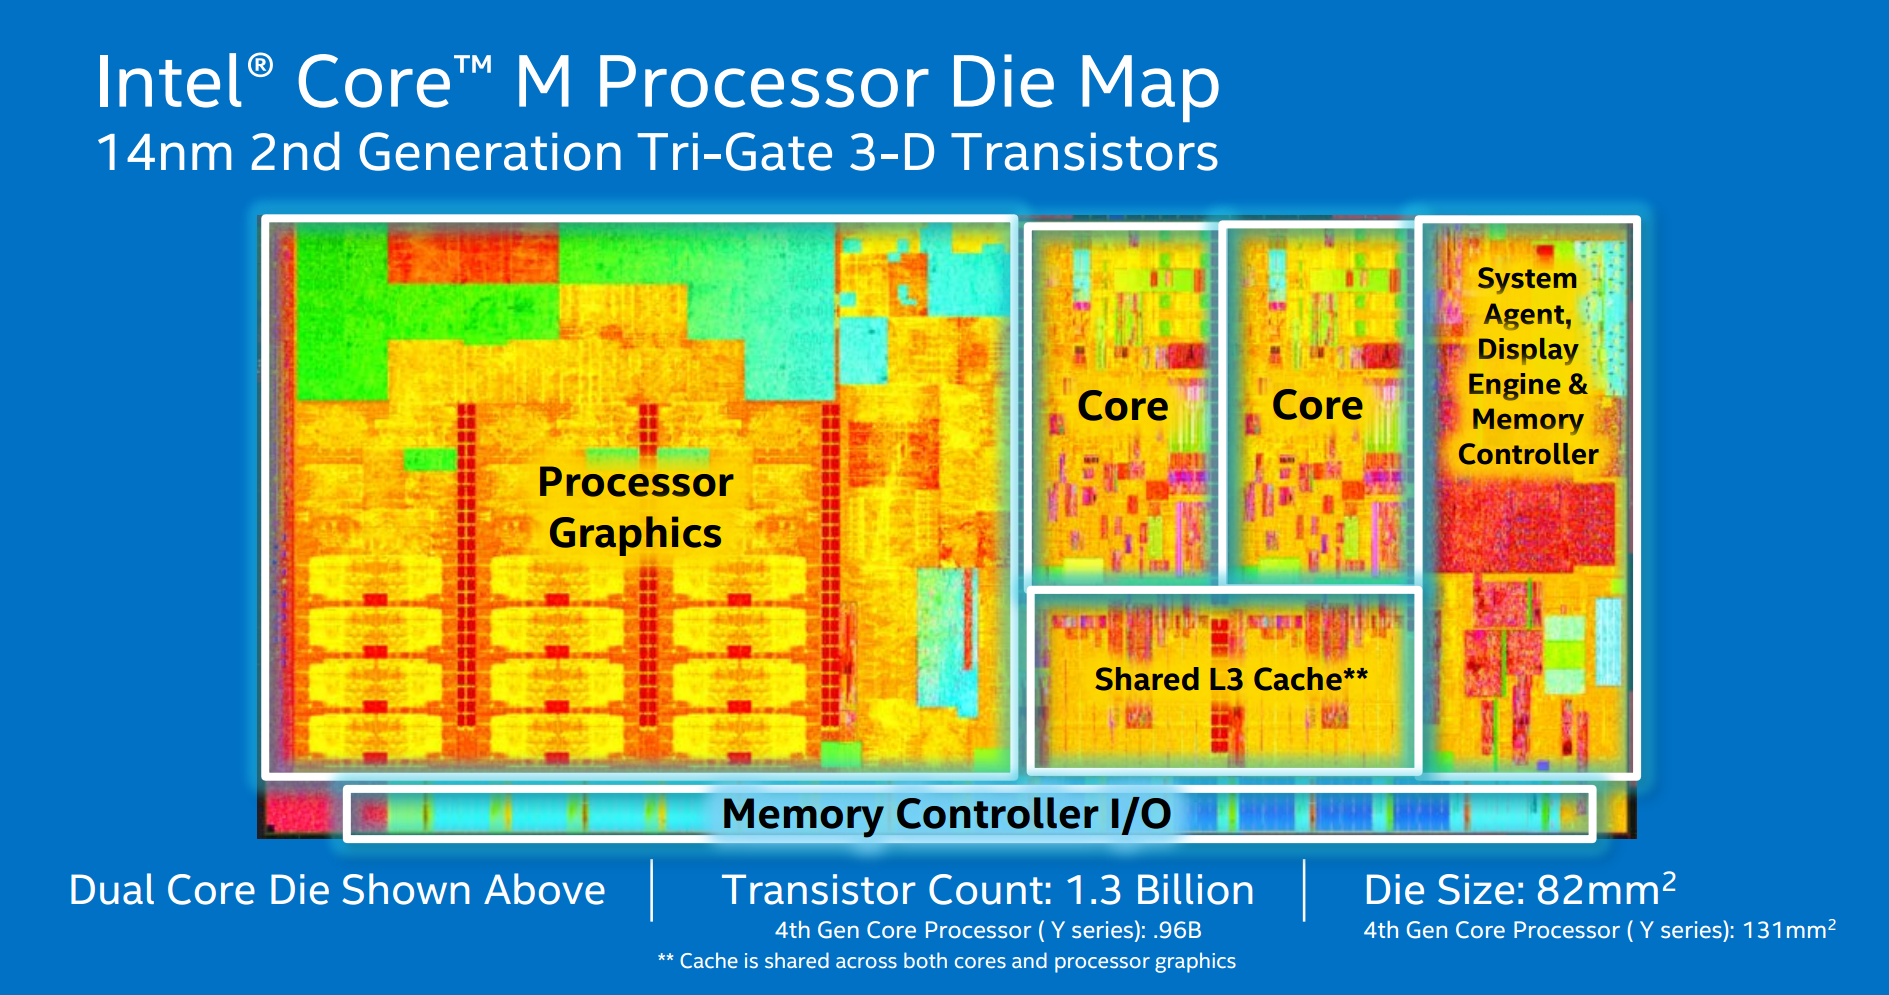
First, let us loop back to the design of Core M, which historically sits in the ‘Y’ processor stack and goes by the codename Broadwell-Y. Core M only comes in dual core flavors with Hyperthreading, with an official TDP of 4.5 watts. Each model comes with 4MB of L3 cache and Intel’s 8th generation of graphics architecture under the designation HD 5300.
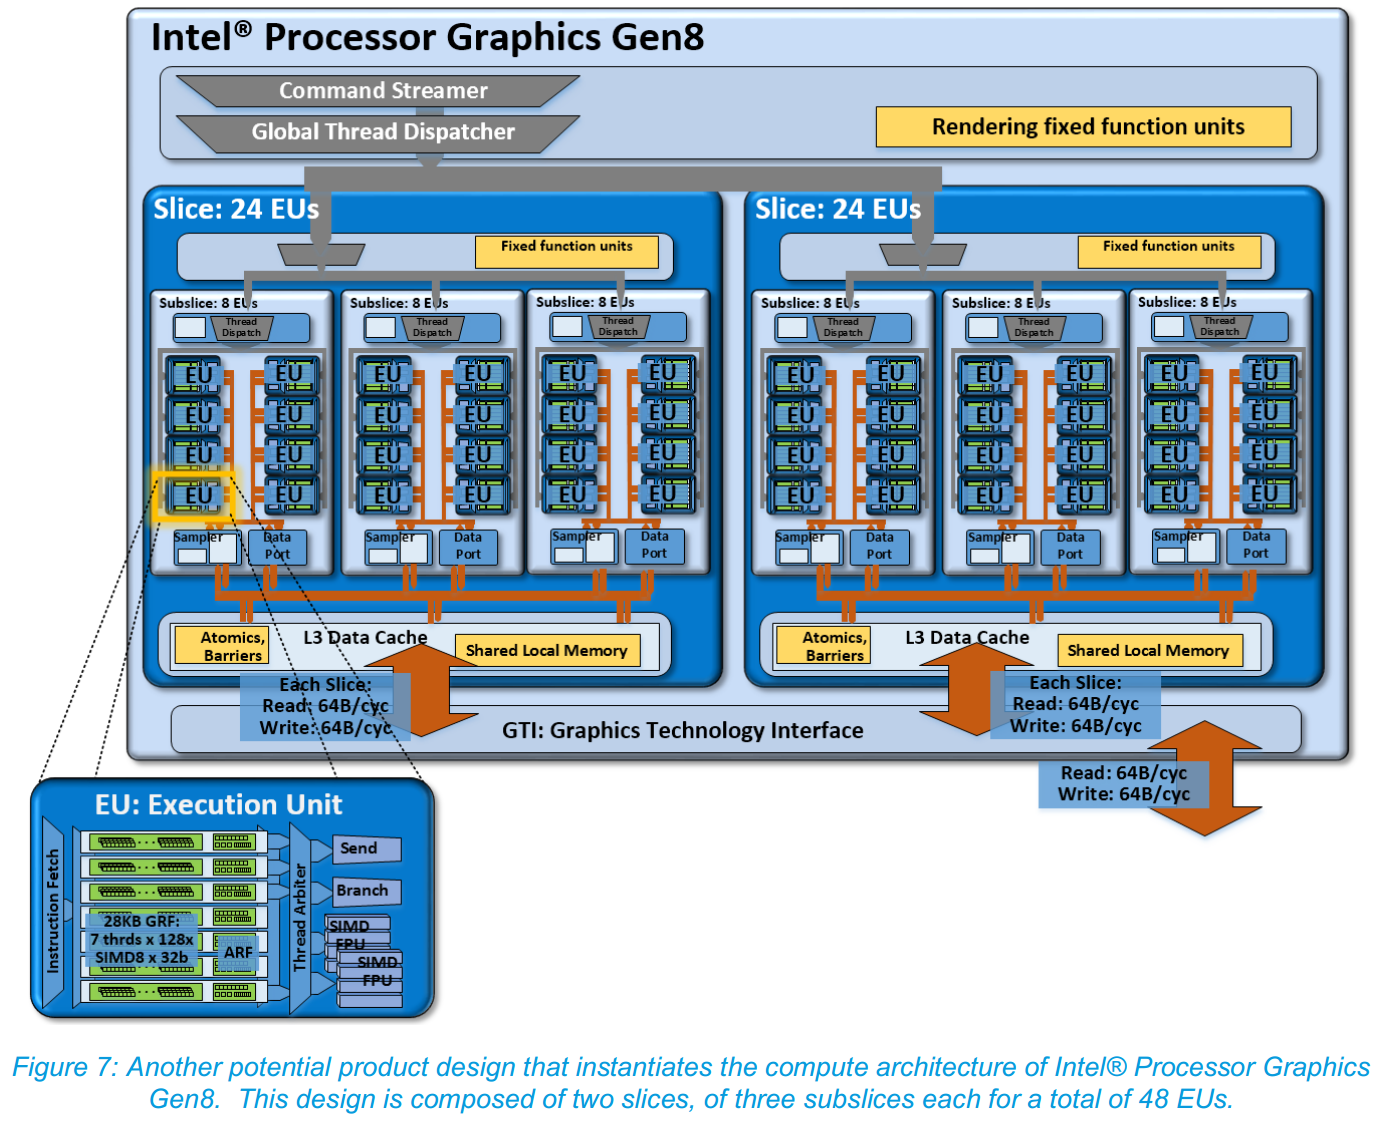
HD 5300 is technically a 24 execution unit design, consisting of a major slice with three sub-slices of eight execution units each. This is double the GT1 / HD (Haswell) design where Intel enables only 12 units (which has benefits when it comes to enhancing yields), or half the full GT3 implementation which keeps the same front end but doubles the major slices. A full on 48-EU design looks something like this, although Core M only has one major slice.
The three main differentiators between each of the SKUs in the Core M line are the processor base frequency, the processor turbo frequency and the integrated graphics frequency range. A number of the processors also support cTDP Up and cTDP Down modes which adjust the base frequency of the processor only. Core M supports Turbo Boost Technology 2.0 which allows individual cores of the silicon to increase in frequency within specified parameters, which may include workload, estimated current/power consumption, and temperature. These two points are key to the rest of the article.
| Core M Specifications | |||||||
| Model Number | 5Y71 | 5Y70 | 5Y51 | 5Y31 | 5Y10c | 5Y10a | 5Y10 |
| Cores/Threads | 2 Cores / 4 Threads | ||||||
| CPU Base/ Boost Frequency |
1.2 GHz 2.9 GHz |
1.1 GHz 2.6 GHz |
1.1 GHz 2.6 GHz |
0.9 GHz 2.4 GHz |
0.8 GHz 2.0 GHz |
0.8 GHz 2.0 GHz |
0.8 GHz 2.0 GHz |
| GPU Base/ Boost Frequency |
300 MHz 900 MHz |
100 MHz 850 MHz |
300 MHz 900 MHz |
300 MHz 850 MHz |
300 MHz 800 MHz |
100 MHz 800 MHz |
100 MHz 800 MHz |
| TDP | 4.5 W | 4.5 W | 4.5 W | 4.5 W | 4.5 W | 4.5 W | 4.5 W |
| cTDP Down (CPU Base) |
3.5 W 600 MHz |
No | 3.5 W 600 MHz |
3.5 W 600 MHz |
3.5 W 600 MHz |
No | No |
| cTDP Up (CPU Base) |
6.0 W 1.4 GHz |
No | 6.0 W 1.3 GHz |
6.0 W 1.1 GHz |
6.0 W 1.0 GHz |
No | No |
| Intel vPro | Yes | Yes | No | No | No | No | No |
Core vs. Atom
In general, Core M is a small departure from Intel (pun intended), bringing its main Core processor architecture, typically used for big core performance, down to power levels and chip sizes better suited for fanless laptops and tablets. Despite the drop in core counts and frequency to reach 4.5 watts, the Core M line typically has a single threaded performance advantage at this power segment as compared the competition, which is no simple achievement.
For Intel, this 4 to 5 watt TDP window for processors has typically been occupied by the Atom line of integrated SoCs. In 2014 this meant Silvermont cores in a Bay Trail system produced at the 22nm process node, but for 2015 will mean Airmont cores in a Cherry Trail system at 14nm. For most of 2014, Atom competed against high powered ARM SoCs and fit in that mini-PC/tablet to sub 10-inch 2-in-1 area either running Android, Windows RT or the full Windows 8.1 in many of the devices on the market.
Despite Intel’s initial long cadence with Atom, we are seeing them step up to the plate and provide an iterative cycle that allows for the latest node technologies combined with the updated graphics technology from the integrated Core ecosystem. Nevertheless, Intel has split this 4 to 5 watt TDP segment into two clear formats based on performance and price.
Atom sits at the lower price band ($50-$100 per chip), typically in a dual or quad core arrangement without hyperthreading and uses ‘modules’ of two discrete cores sharing an L2 cache. The integrated IO is designed to be enough for this market segment, as seen in the recently announced Surface 3, and shows that devices in the $500 region are ripe for the next Atom SoCs. Note that Braswell, which also uses Airmont cores at 14nm but goes under the Celeron/Pentium nomenclature, also sits in this 4 to 6 watt region but is aimed more at the mini-PC arena.
Intel lists all of the Core M processors at $281, and a user will be hard pressed to find a Core M device priced under $700 on the market now; such is the gap that Intel wants to strike with the two platforms. Core M sits at the heart of the new Macbook (read our hands on), as well as most of the devices in this test such as the ASUS UX305, Lenovo Yoga 3 Pro and the Dell Venue 11 Pro 7000. With the Broadwell architecture and hyperthreading under its belt, the results do speak for themselves as Core M attacks the Haswell-U line from the last 18 months in terms of direct performance.


110 Comments
View All Comments
zodiacfml - Wednesday, April 8, 2015 - link
A long for this look at the performance Core M. Thanks. Like all nice, popular movies the end is pretty expected after a review from the Asus UX305. It's also good that the Dell is there to provide the scores for no limitation on cooling for long continuous loads.After all this, I don't see any problem. The performance of the Asus is pretty expected as well having a tradional notebook design which is fairly overkill for the SDP/TDP.
I was a PC overclocker many years ago and then realized that underclocking and overclocking at the same time would be ideal. I believe the race to wider CPU dynamic range has become mainstream.
dragonsqrrl - Wednesday, April 8, 2015 - link
"Each model comes with 4MB of L2 cache" On the first page.Shouldn't that be L3 cache?
dananski - Wednesday, April 8, 2015 - link
I love how the Asus tries to draw a piano keyboard in the PCMark 8 Creative graph. Very creative of it.DryAir - Wednesday, April 8, 2015 - link
The temperature x time graphs are all messed up. The lines goes "back" on many ocasions, indicating 2 different temperatures on a same time stamp. You should check the settings on whatever program you are using to generate these graphics.be_prime - Wednesday, April 8, 2015 - link
I just signed up to comment on the same thing -- the graphs are so clearly distorted by some (no doubt well-intentioned) spline/smoothing that much (even most?) of the data we see here may be the product of a spline or interpolation process, and not represent a data measurement. Where the line goes "back", as DryAir pointed out, it implies time travel.That's a very big miss for a site that I've considered to be thoughtful and authoritative. The approach you took here presents false and interpolated data and obscures the quality of your research. Don't let the goal of an attractive graph ruin the whole point of the graph: showing the data.
These graphs are obviously impossible due to the spline/interpolation used, and should be replaced by a scatter plot or normal line graph.
Brett Howse - Wednesday, April 8, 2015 - link
As I mentioned on the Devices and Test page, sometimes the devices were very heavily loaded and they were not able to log consistently. Sometimes they would log twice in the same second, but with slightly different values. One log would be time 0:00:01:05, and another would log 0:00:01:95 (for instance), but both would be truncated to the same second. Unfortunately that's just the limit of the software, since it only logs time to the nearest second. A second can be a lot of time for a CPU.be_prime - Thursday, April 9, 2015 - link
That's fine because those data points represent measurements.The problem here is you've used interpolated splines/curves which, in this case, actually show impossible or false information: the curve leaning "left" implies that the x-axis (time) is decreasing: that's time travel, and it'd be a bigger story than the Core M for sure, right?
Also recognize that if you're gathering data points, but drawing a line, you're always implicitly creating an interpolation between those points (at least in viewers minds). Usually, it doesn't matter so much. Here, the resulting lines are false, and I think Anandtech is a better publication than that.
As it stands, the interpolation/smoothing on your graphs implies time travel. Respectfully: please correct this (or, patent the relevant technology and profit!). If you're going to make your graphs look "pretty" and don't care if they're correct, I can't trust your results.
DryAir - Friday, April 10, 2015 - link
Sarcastic time travel jokes aside, I agree that you should change it somehow. Perhaps just change the data points to be connected to a straith line, instead of a smoothed one. Right now its looking very amateuristic, not matching an otherwise great and highly technical review.Brett Howse - Friday, April 10, 2015 - link
Ice Storm was the worst offender so I've re-generated the graphs with straight lines. There just was not enough data points on that one because it was so short.gw74 - Wednesday, April 8, 2015 - link
I am furious that OEMs are using Core M in ultrabooks. It is the solution to a problem which does not exist. The Samsung Series 9 / ATIV 9 Plus use full fat i5 and i7 ULVs and the 2 tiny fans hardly ever come on. when they do, they sound like mice whispering. and huge battery life.Core M is not progress when used in the ultrabook factor. it is a step backwards and a ripoff.