The Apple A15 SoC Performance Review: Faster & More Efficient
by Andrei Frumusanu on October 4, 2021 9:30 AM EST- Posted in
- Mobile
- Apple
- Smartphones
- Apple A15
CPU ST Performance: Faster & More Efficient
Starting off with this year’s review of the A15, in order to have a deeper look at the CPU single-threaded performance and power efficiency, we’re migrating over to SPEC CPU 2017. While 2006 has served us well over the years and is still important and valid, 2017 is now better understood in terms of its microarchitectural aspects in its components, and becoming more relevant as we moved our desktop side coverage to the new suite some time ago.
One continuing issue with SPEC CPU 2017 is the Fortran subtests; due to a lacking compiler infrastructure both on iOS and Android, we’re skipping these components entirely for mobile devices. What this means also, is that the total aggregate scores presented here are not comparable to the full suite scores on other platforms, denoted by the (C/C++) subscript in the score descriptions.
As always, because we’re running completely custom harnesses and not submitting the scores officially to SPEC, we have to denote the results as “estimates”, although we have high confidence in the accuracy.
In terms of compiler settings, we’re continuing to employ simple -Ofast flags without further changes, to be able to get the best cross-platform comparisons possible. On the iOS side of things, we’re running on the newest XCode 13 build tools, while on Android we’re running the NDKr23 build tools.
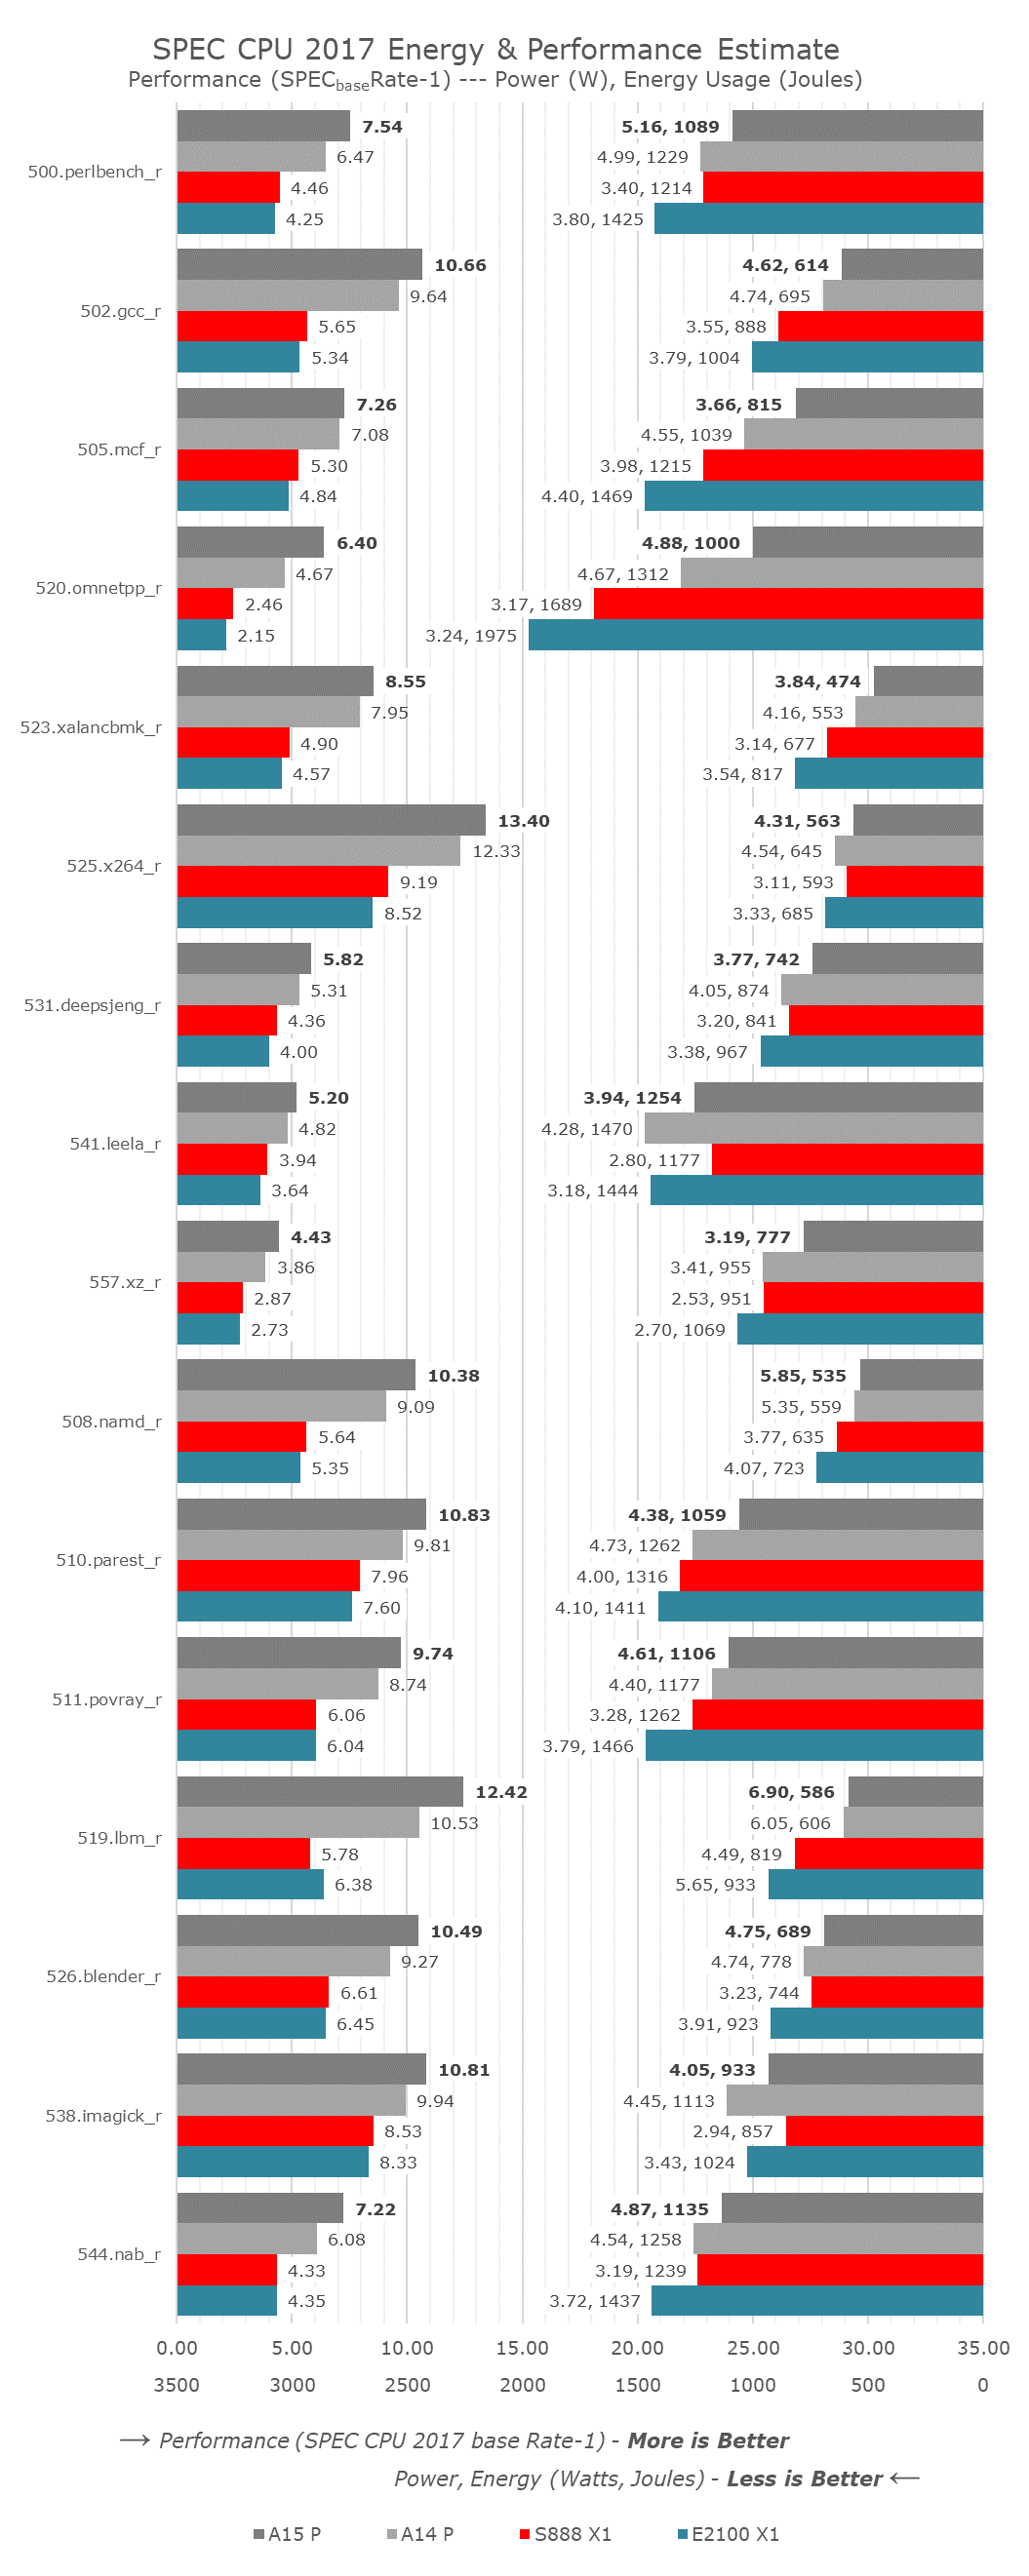
In terms of performance and efficiency details, we’re swapping the graphs around a bit from now on – on the left axis we have the performance scores of the tests – larger bars here mean better performance. On the right-side axis, growing from right to left are the energy consumption figures for the platforms, the smaller the figure, the more energy efficient (less energy consumed) a workload was completed. Alongside the energy figure in Joules, we’re also showcasing the average power figure in Watts.
Starting off with the performance figures of the A15, we’re seeing increases across the board, with absolute performance going up from a low of 2.5% to a peak of +37%.
The lowest performance increases were found in 505.mcf_r, a more memory latency sensitive workload; given the increased L2 latency as well as slightly higher DRAM latency, it doesn’t come too unexpected to see a more minor performance increase. However, when looking at the power and efficiency metrics of the same workload, we see the A15 use up almost 900mW less than the A14, with energy efficiency improving by +22%. 520.omnetpp_r saw the biggest individual increase at +37% performance – power here went up a bit, but energy efficiency is also up 24%.
The smallest performance gains of the A15 are found in the most back-end execution bound workloads, 525.x264_r and 538.imagick_r improve by only 8.7%, resulting in an IPC increase of 0.6% - essentially within the realm of measurement noise. Still, even here in this worst performance case, Apple still managed to improve energy efficiency by +13%, as the new chip is using less absolute power even though clock frequencies have gone up.
The most power demanding workload, 519.lbm_r, is extremely bandwidth hungry and stresses the DRAM the most in the suite, with the A15 chip here eating a whopping 6.9W of power. Still, energy efficiency is generationally slightly improved as performance goes up by 17.9% - based on first teardown reports, the A15 is still only powered by LPDDR4X-class memory, so these improvements must be due to the chip’s new memory subsystem and new SLC.
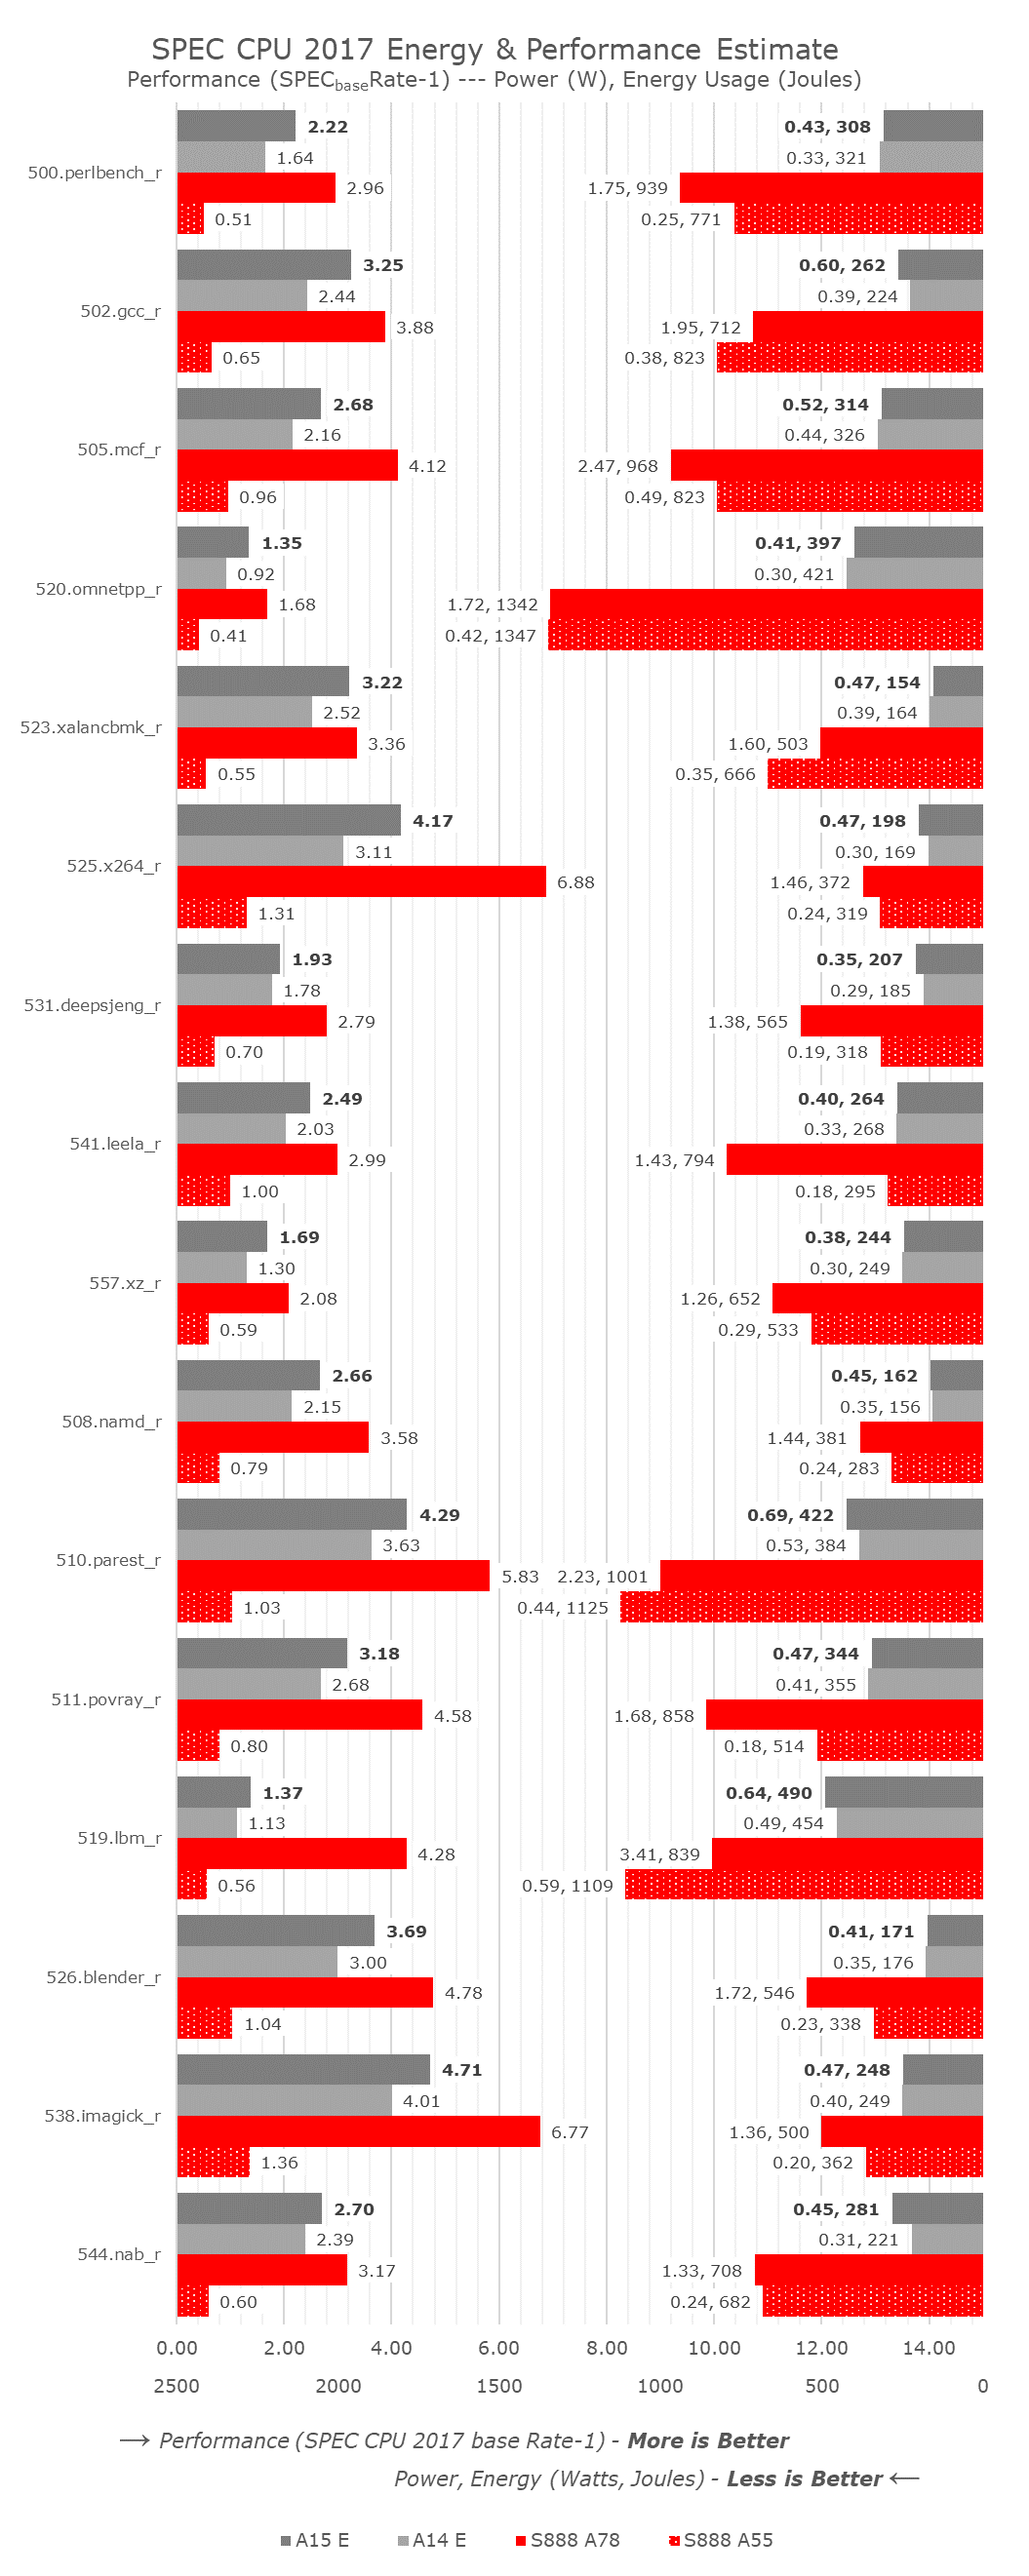
Shifting things over to the efficiency cores, I wanted to make comparisons not only to the A14’s E-cores, but also put the Apple chips in context to the competition, a Snapdragon 888 in this context, comparing against a 2.41GHz Cortex-A78 mid-core, as well as a 1.8GHz Cortex-A55 little core.
The A15’s E-cores are extremely impressive when it comes to performance. The minimum improvement varies from +8.4 in the 531.deepsjeng_r, essentially flat up with clocks, to up to again +46% in 520.omnetpp_r, putting more evidence into some sort of large effective sparse memory access parallelism improvement for the chip. The core has a median performance improvement of +23%, resulting in a median IPC increase of +11.6%. The cores here don’t showcase the same energy efficiency improvement as the new A15’s performance cores, as energy consumption is mostly flat due to performance increases coming at a cost of power increases, which are still very much low.
Compared to the Snapdragon 888, there’s quite a stark juxtaposition. First of all, Apple’s E-cores, although not quite as powerful as a middle core on Android SoCs, is still quite respectable and does somewhat come close to at least view them in a similar performance class. The comparison against the little Cortex-A55 cores is more absurd though, as the A15’s E-core is 3.5x faster on average, yet only consuming 32% more power, so energy efficiency is 60% better. Even for the middle cores, if we possibly were to down-clock them to match the A15’s E-core’s performance, the energy efficiency is multiple factors off what Apple is achieving.
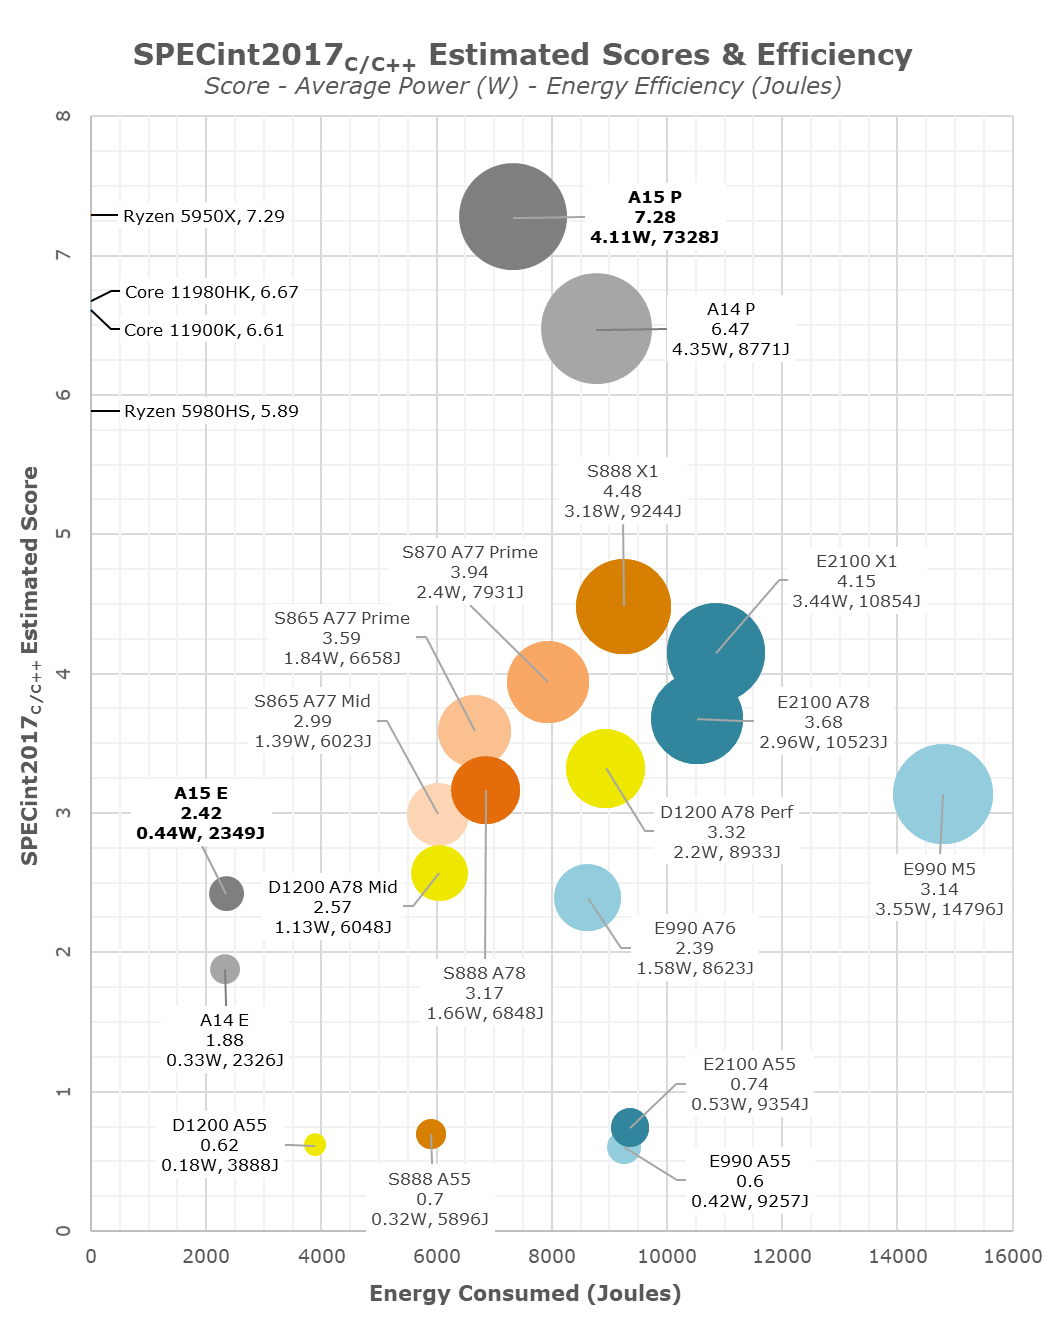
In the overview graph, I’m also changing things a bit, and moving to bubble charts to better spatially represent the performance to energy efficiency positioning, as well as the performance to power positioning. In the energy axis graphs, which I personally find to be more representative of the comparative efficiency and resulting battery life experiences of the SoCs, we see the various SoCs at their peak CPU performance states versus the total energy consumed to complete the workloads. On the power axis graphs, we see the same data, only plotted against average power. Generally, I find distinction of efficiency here to be quite harder between the various data-points, however some readers have requested this view. The bubble size corresponds to the average power of the various CPUs, we’re measuring system active power, meaning total device workload power minus idle power, to compensate components such as the display.
Apple A15 performance cores are extremely impressive here – usually increases in performance always come with some sort of deficit in efficiency, or at least flat efficiency. Apple here instead has managed to reduce power whilst increasing performance, meaning energy efficiency is improved by 17% on the peak performance states versus the A14. If we had been able to measure both SoCs at the same performance level, this efficiency advantage of the A15 would grow even larger. In our initial coverage of Apple’s announcement, we theorised that the company might possibly invested into energy efficiency rather than performance increases this year, and I’m glad to see that seemingly this is exactly what has happened, explaining some of the more conservative (at least for Apple) performance improvements.
On an adjacent note, with a score of 7.28 in the integer suite, Apple’s A15 P-core is on equal footing with AMD’s Zen3-based Ryzen 5950X with a score of 7.29, and ahead of M1 with a score of 6.66.
The A15’s efficiency cores are also massively impressive – at peak performance, efficiency is flat, but they’re also +28% faster. Again, if we would be able to compare both SoCs at the same performance level, the efficiency advantage of the A15’s E-cores would be very obvious. The much better performance of the E-cores also massively helps avoiding the P-cores, further improving energy efficiency of the SoC.
Compared to the competition, the A15 isn’t +50 faster as Apple claims, but rather +62% faster. While Apple’s larger cores are more power hungry, they’re still a lot more energy efficient. Granted, we are seeing a process node disparity in favour of Apple. The performance and efficiency of the A15 E-cores also put to shame the rest of the pack. The extremely competent performance of the 4 efficiency cores alongside the leading performance of the 2 big cores explain the significantly better multi-threaded performance than the 1+3+4 setups of the competition.
Overall, the new A15 CPUs are substantial improvements, even though that’s not immediately noticeable to some. The efficiency gains are likely key to the new vastly longer battery longevity of the iPhone 13 series phones – more on that in a dedicated piece in a few days, and in our full device review.


204 Comments
View All Comments
repoman27 - Monday, October 4, 2021 - link
By 2023 Apple SoCs will likely include integrated 5G, seeing as they spent $1B to acquire Intel’s modem division. Until then, Qualcomm discrete is really their only option.cha0z_ - Tuesday, October 5, 2021 - link
As said - no integrated modem is entirely doing of qualcomm. Won't last long tho, apple are already deep into designing their own 5G modem ;)5j3rul3 - Monday, October 4, 2021 - link
Will anandtech review iPad mini 2021 and iPad Pro 12.9 2021?Andrei Frumusanu - Monday, October 4, 2021 - link
Currently we have no plans on the iPads, no.5j3rul3 - Monday, October 4, 2021 - link
Thank you!name99 - Monday, October 4, 2021 - link
I would be curious if you at least ran the latency tests on an M1 device, to compare.That would allow us to perhaps understand how the L2 is split.
Right now one can imagine at least three possibilities:
- drowsy cache with three or four segments (usually you do this by sleeping some fraction of the ways), so that as you go larger some fraction of the time you are hitting a drowsy segment more often and taking an extra cycle
- virtual L3. ie each core gets half the L2, and some fraction (again likely by way) of the L2 "attached" to the other core is treated as virtual L3
- your hypothesis for the A13 that some fraction of the L2 was (either absolutely, or effectively in terms of the heuristics used) locked to use by the E cores
If we has curves for M1 (with 4 rather than 2 P clients) the relative fractions at each size might serve to stengthen vs weaken among these options.
Andrei Frumusanu - Monday, October 4, 2021 - link
We had run latency on M1 when I still had it; https://images.anandtech.com/doci/16252/latency-m1...It obviously looks quite different. I've determined before that Apple does some logical partitioning of the caches, it's a bit hard to measure one core while the other does something.
name99 - Monday, October 4, 2021 - link
Thanks for the plot!That seems to show jumps at 3MB and 6MB, which does suggest a per-core split (whether logical or physical, who knows; does the question even have any real meaning?).
I can make up a model for it (each cache gets 3MB of L2, other core's L2 can be used as virtual L2, each of the 3MB is split into three segments that are independently drowsy) which kinda fits what we see, and which one can kinda retrofit to the A14 graph.
I'm always loathe to blame "energy saving" for weird anomalies; in this case drowsy cache. But it's not a completely crazy hypothesis. On the other hand, we know that the SLC is also drowsy (thought at a rather finer granularity) and yet we don't see an obvious jump signature of drowsiness there (though maybe we wouldn't, given the fine granularity; just a steady ramp in mean access time?)
I could imagine that the way the split works is something like half the tags, and so half the way's are "allocated" to one core rather than the other. If you find the result in "your" tag lookup, great; if not, lose a cycle and look in the tags of the other core(s)? Would mostly work well, uses lower energy, and you only have to pay the occasional extra tag lookup(s) when you're sharing data or code with another core.
This would imply that you could see a signature of the effect by investigating how many ways the cache presents. It should appear to present say 4 fast ways and 4 slower ways (or 3 fast ways and 9 slower ways for 4 cores). One more thing to add to the list of stuff to experiment with!
5j3rul3 - Monday, October 4, 2021 - link
Hope there's display efficiency measurements for iPhone 13 and iPhone 13 pro's displayAnd, I'm so curious that why there's no 60 Hz VRR smartphones?
5j3rul3 - Monday, October 4, 2021 - link
The iPhone's VRR is interesting I think, and hope some detailed analysis on it.