How We Test PCIe 4.0 Storage: The AnandTech 2021 SSD Benchmark Suite
by Billy Tallis on February 1, 2021 1:15 PM EST
The last major update to our consumer SSD benchmark suite was introduced in 2017. A lot has changed in the SSD market over the past several years, and our SSD testing methods need to change in response to those trends. SSDs in general have been getting more complex, so there are more ways for benchmarks to end up being misleading or unrealistic. This might be on accident, or as part of a deliberate PR strategy to obfuscate the real world performance behind a 'holy' unified metric. [pun intended]
The nature of testing hardware has also changed, especially in light of the need to support the latest technologies like PCIe 4.0, We also find it relevant to more closely resemble the kinds of hardware our readers are now likely to be using. This article introduces the new 2021 edition of our consumer SSD test suite. It covers the goals and rationale behind the design choices, the hardware and software configurations used, and the details of each benchmark and its purpose. It is our hope that this new test suite will be suitable for the next several years of SSD reviews.
SSD Benchmarking: The AnandTech Heritage
To start, we need to review a bit about how SSDs work. Anand's classic articles from 2009, such as The SSD Anthology and The SSD Relapse, document many of the early challenges SSDs had to overcome on the way to taking over as the mainstream consumer storage technology. More than a decade later, those articles are still valuable background information on how today's SSDs work. All of the fundamental challenges of dealing with NAND flash memory still apply: the inability to make in-place modification to data stored in NAND flash, the disparity between NAND page sizes and erase block sizes, the need for wear leveling and the consequent performance drops when a drive is full are all still relevant. Today's SSDs are much bigger, faster and cheaper, but their controllers and firmware still need to deal with those issues. Today's SSDs also layer on some extra challenges that make their inner workings even more complicated, and require more sophisticated testing to properly assess.
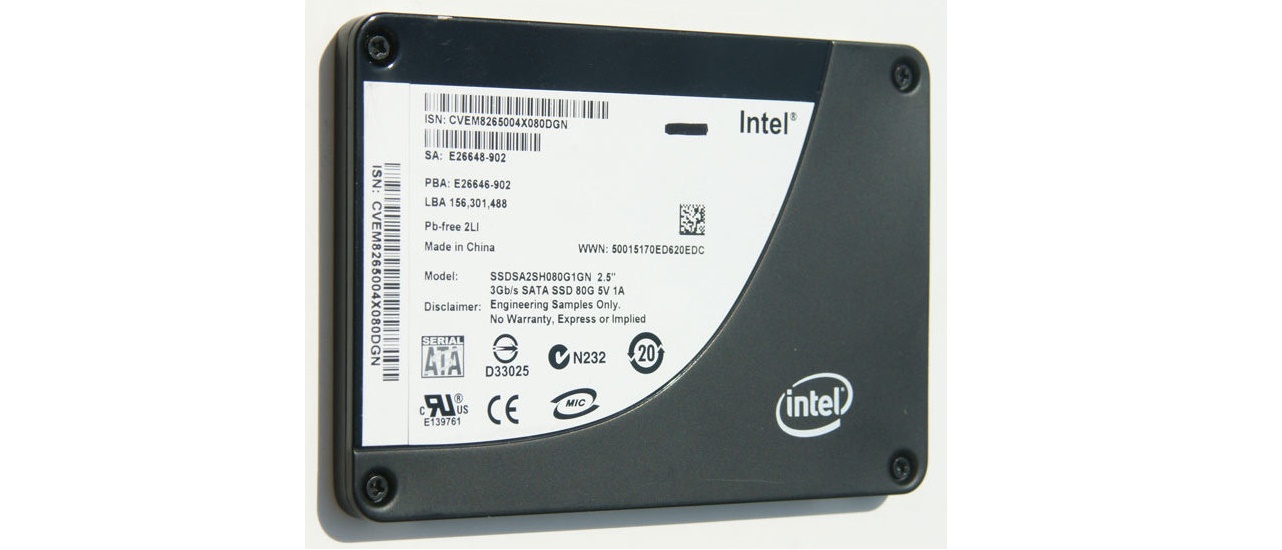
Anyone remember Intel's X25-M, using 50nm NAND?
When I started reviewing SSDs for AnandTech in 2015, TLC NAND and NVMe were only beginning to creep into the consumer market: TLC at the low end, and NVMe at the high end. Both have now taken over: MLC has all but disappeared from the market, and NVMe is the default choice for new systems. (In Micron's most recent earnings call, they shared that their client SSD shipments are now over 90% NVMe by number of bits shipped.) The higher performance allowed by PCIe and NVMe rather than SATA make stunning differences in benchmark scores, but the migration to TLC was actually more significant from the perspective of benchmark design. That's because consumer TLC SSDs rely heavily on SLC caching.
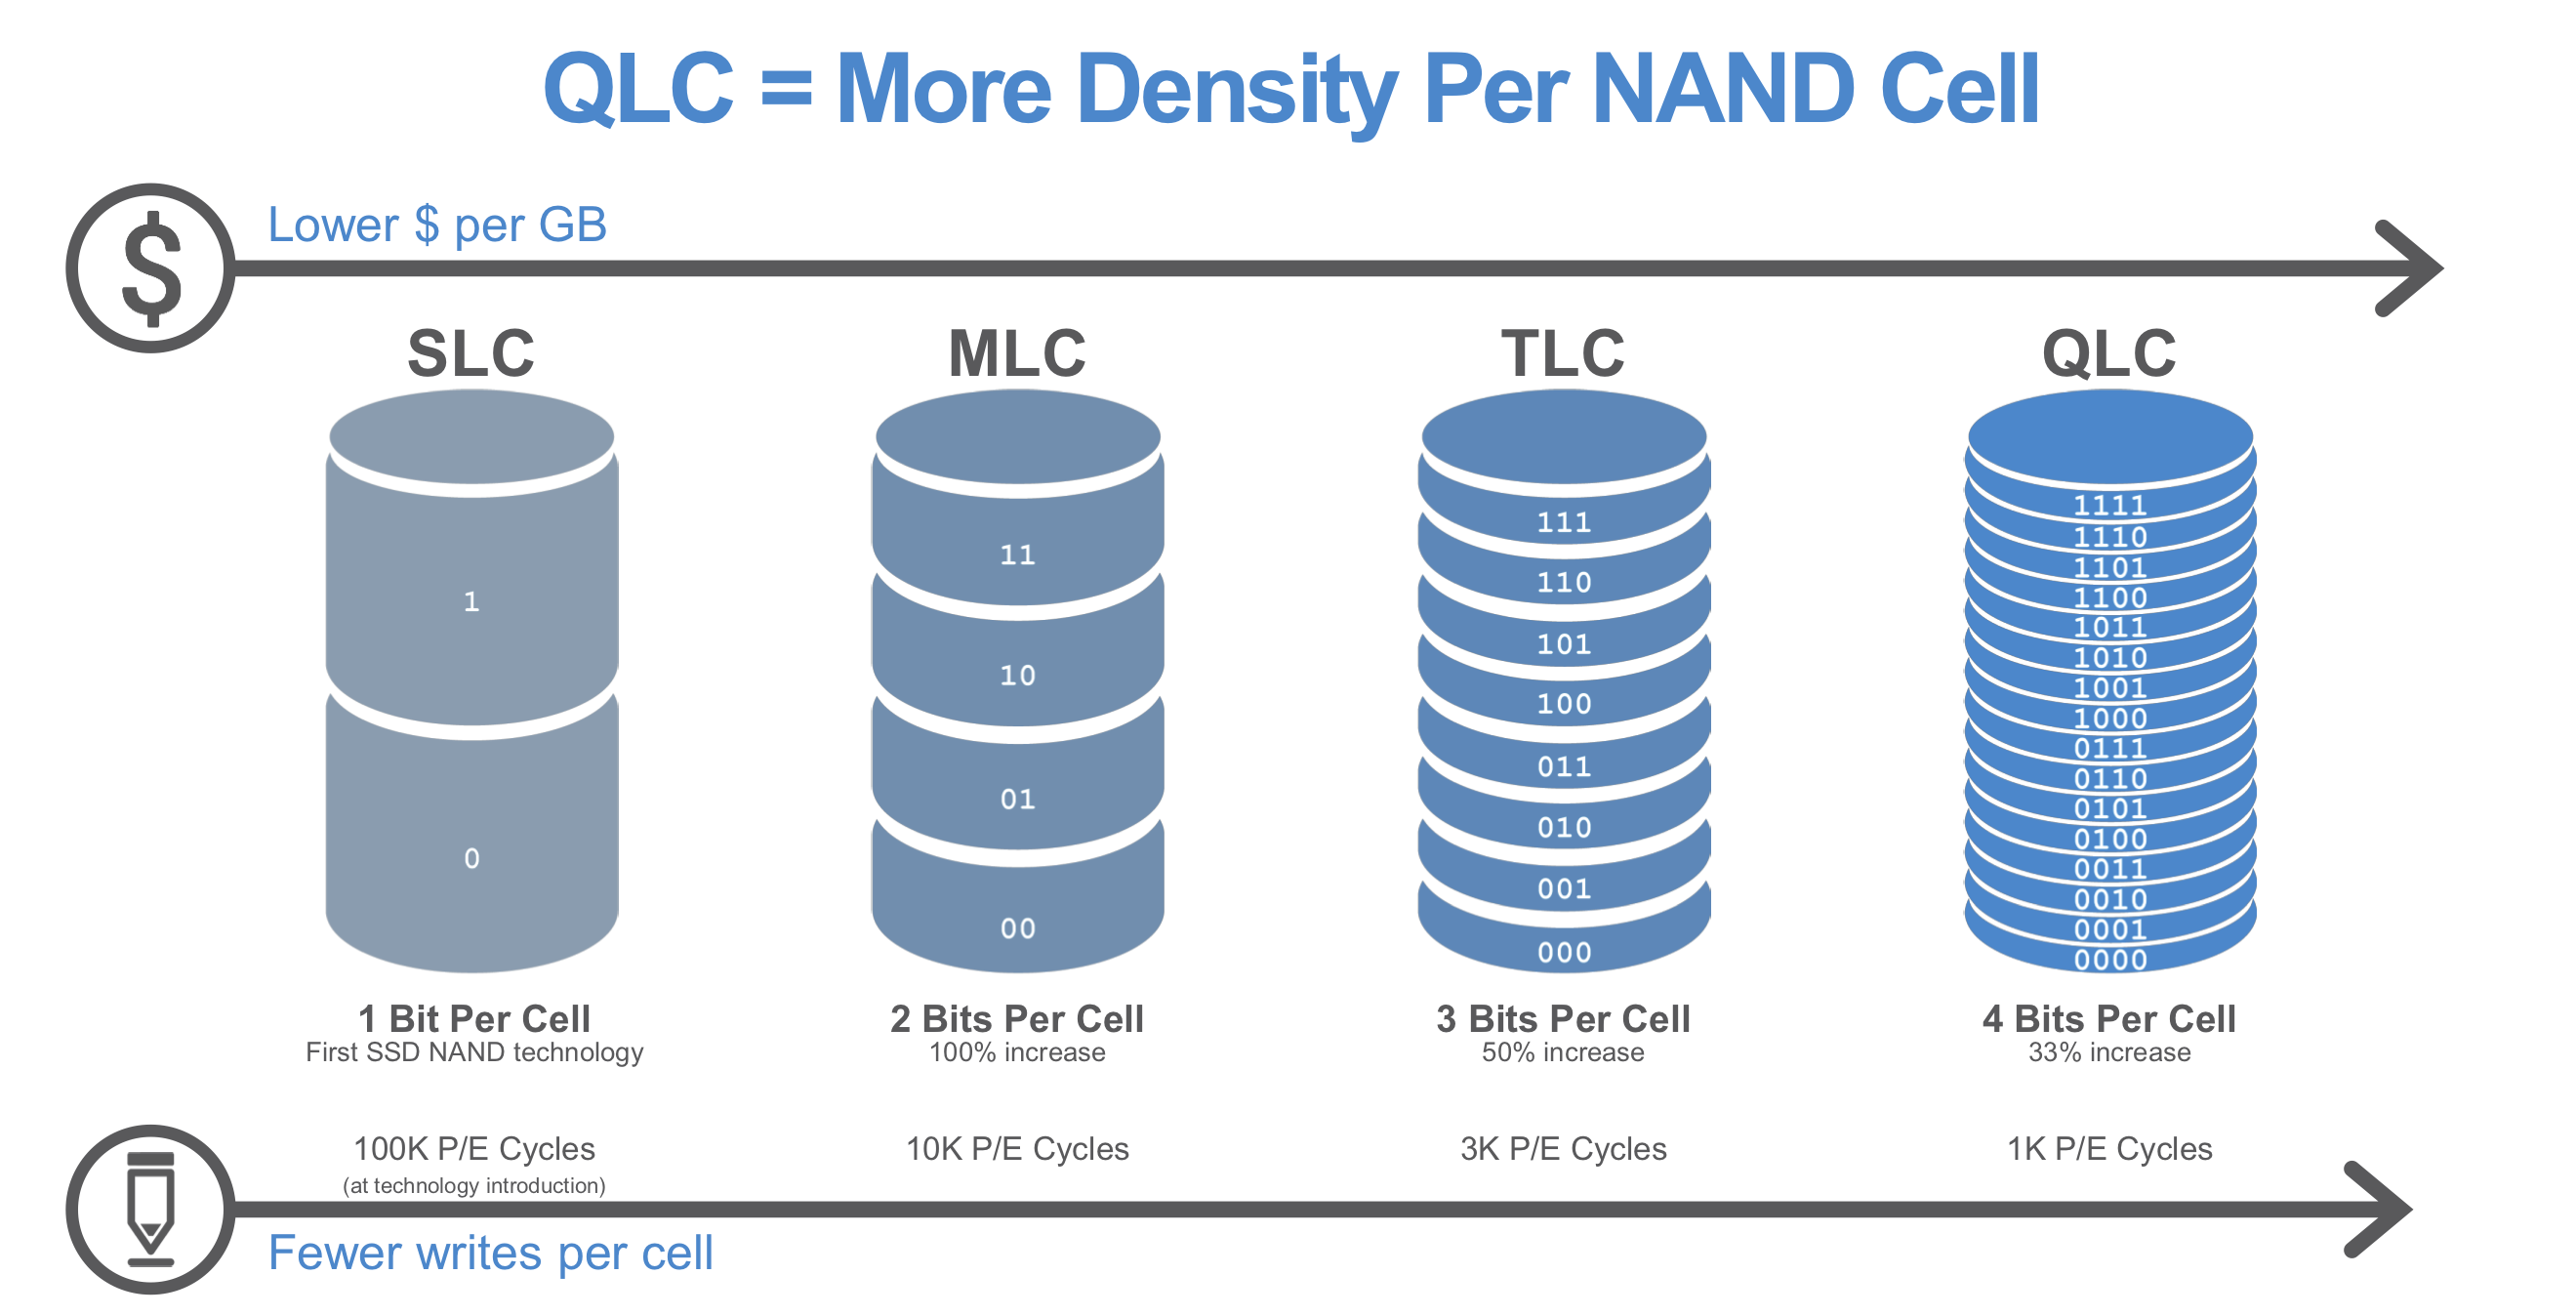
In a drive, the more bits you write to a cell, the more complex (and slower it is). Modern drives run 3 bits-per-cell, known as TLC, and 4 bits per cell, known as QLC. Both of these are slower for writes than 1 bit per cell, or SLC. By treating a portion of the drive cells as one bit per cell, known as 'SLC mode'. this allows the drive to absorb a burst of writes more quickly. This is because programming the voltage of an SLC cell can be done in one step and doesn't require as much precision as when storing multiple bits per cell.
The downside is that data written to SLC NAND must later be re-written into blocks that are operating as MLC/TLC/QLC, storing multiple bits per cell. This process (often called folding) is usually automatically performed by the drive during idle time, where latency is not important. This freee up the space in the SLC cache for future use. SLC caching is generally not used by enterprise SSDs because it makes performance less predictable and is detrimental to sustained write performance, but for client and consumer SSDs SLC write caching is now nearly universal: essentially all TLC and QLC SSDs use SLC write caching.
Modern SSDs: Always SLC Write Caching
SLC write caching has obvious implications for any benchmark that writes data to the SSD. SLC caches have a limited size, which creates two tiers of performance - one inside the cache, and one outside a cache. Most users with office-like workloads never see the 'outside-the-cache' performance. Any workload or test that writes data continuously at high speed, such as benchmark after benchmark after benchmark, can eventually overflow the cache and experience a performance drop to the lower tier of performance. Real-world consumer workloads almost never write tens or hundreds of GB continuously, especially not at extremely high speeds (ie. faster than gigabit Ethernet) - even recording uncompressed 4k60 video is a bit less than 1.5GB/s, while high-end NVMe SSDs are now offering peak write speeds in excess of 4GB/s. This is important because some SSD benchmarking involves one test followed by another then by another - enabling a more real-world use case, with adequate breaks for the drive to free up the SLC cache during idle, makes the test more relevant to lots of users.
SLC cache sizes are also variable on many drives, with the available cache size shrinking as the drive fills up. Thus a user with a 75% full SSD might only have 10% of the regular SLC cache size when the drive is empty. Drive vendors are increasingly choosing to configure SSDs to use as much space as possible for the SLC cache. Tests that operate with a mostly-empty drive can exaggerate the benefits of SLC caching as compared to what users experience when they actually use most of their SSD's advertised capacity. QLC SSDs have also introduced another complication to SLC caching, because they don't use the cache just for write operations. A typical TLC SSD will start clearing out the cache almost as soon as host IO activity ceases, trying to make the most of the idle time to prepare for future bursts of writes. By contrast, the more common behavior for QLC SSDs seems to be leaving data in the SLC cache until the cache is nearly full, so that recently-written data can be accessed again with low latency—and perhaps avoiding some unnecessary re-writes for data that turns out to be short-lived.

NVMe SSDs (and the rare SATA drive) have also made temperature a potential concern. M.2 SSDs drawing over 5W at peak can get quite hot, and it is now common for enthusiast-oriented SSDs and desktop motherboards to provide heatsinks for M.2 drives. During ordinary use, thermal throttling is seldom a problem because real workloads can't keep a fast SSD busy continuously, but it is also fairly easy for benchmarks to trigger. The synthetic benchmarks we were using up to about four years ago tested each IO pattern (random read, sequential write, etc.) for three minutes at each queue depth, for 18 minutes of uninterrupted IO per test. That's enough to trigger thermal throttling on any drive that's prone to overheating, and for the write tests to overflow the SLC cache on most drives. That kind of test can be useful for studying how a drive behaves under extreme conditions, but it doesn't say much about how it would perform in normal use.
Limiting benchmark duration isn't always enough to ensure that a test doesn't go overboard. The huge performance disparities between SATA and PCIe 4.0 NVMe SSDs mean that a 10-second test that makes sense for a SATA drive could end up forcing a NVMe drive to do more than ten times as much work. For this reason, our synthetic benchmarks put limits on both running time and the amount of data transferred by each test, helping to keep the tests more realistic and more practical.
SSD Data: Locality and DRAM
There are also a few other important technological differences between high-end and entry-level consumer SSDs beyond just the choice of interface (SATA, PCIe 3.0, PCIe 4.0) and whether the drive is using TLC or QLC NAND flash memory. The next most significant difference is in how drives store and access the metadata used by the Flash Translation Layer (FTL)—information about what physical location is currently being used to store each Logical Block Address (LBA).
For at least a few years, most SSDs on the market were using the same basic technique, popularized by the Intel DC S3700: a big, simple lookup table for translating LBAs into physical memory addresses. Even though consumer SSDs still default to presenting the illusion of 512-byte LBAs for the sake of compatibility with software written for hard drives, most drives use a FTL that operates on 4kB sectors. From that fact, it only takes a little bit of math to derive that the FTL's mapping table needs just under 1GB of space to manage 1TB of NAND flash. This adds cost to a drive, which is important in a market where often the lowest cost operator wins. Including DRAM in that proportion to the amount of flash is still standard practice for high-end SSDs, but new techniques allow the drive to trade performance for that extra DRAM cost.
Most entry-level SSD controllers no longer have a DRAM interface, or at least are offered in a more compact package that doesn't have the necessary pins exposed. These DRAMless controllers and the SSDs built around them have to manage their FTL without being able to load all of it into memory at once. The controllers commonly have on-die caches with capacity in the megabytes range, and NVMe SSDs also have the option of borrowing some of the CPU's RAM through the Host Memory Buffer (HMB) feature.
There are two main downsides to SSDs that don't have full-sized DRAM buffers: First, random reads are more likely to require an extra flash read operation to fetch the mapping information before the requested data can be read. Second, drives that cannot keep the entire FTL in memory have a harder time managing wear leveling and garbage collection, so they tend to suffer greater performance drops under write-heavy workloads and when nearly full.
The New 2021 SSD Benchmark Suite
For our new suite, the nature of the new elements of the SSD market have been taken into account in our testing. While we have been cognizant of all the issues listed above in our previous testing, the need for new tests to indicate why certain design choices affect the performance of the drive, and what it means to end-users is always a critical element that needs updating and examining regularly.
Example Drives
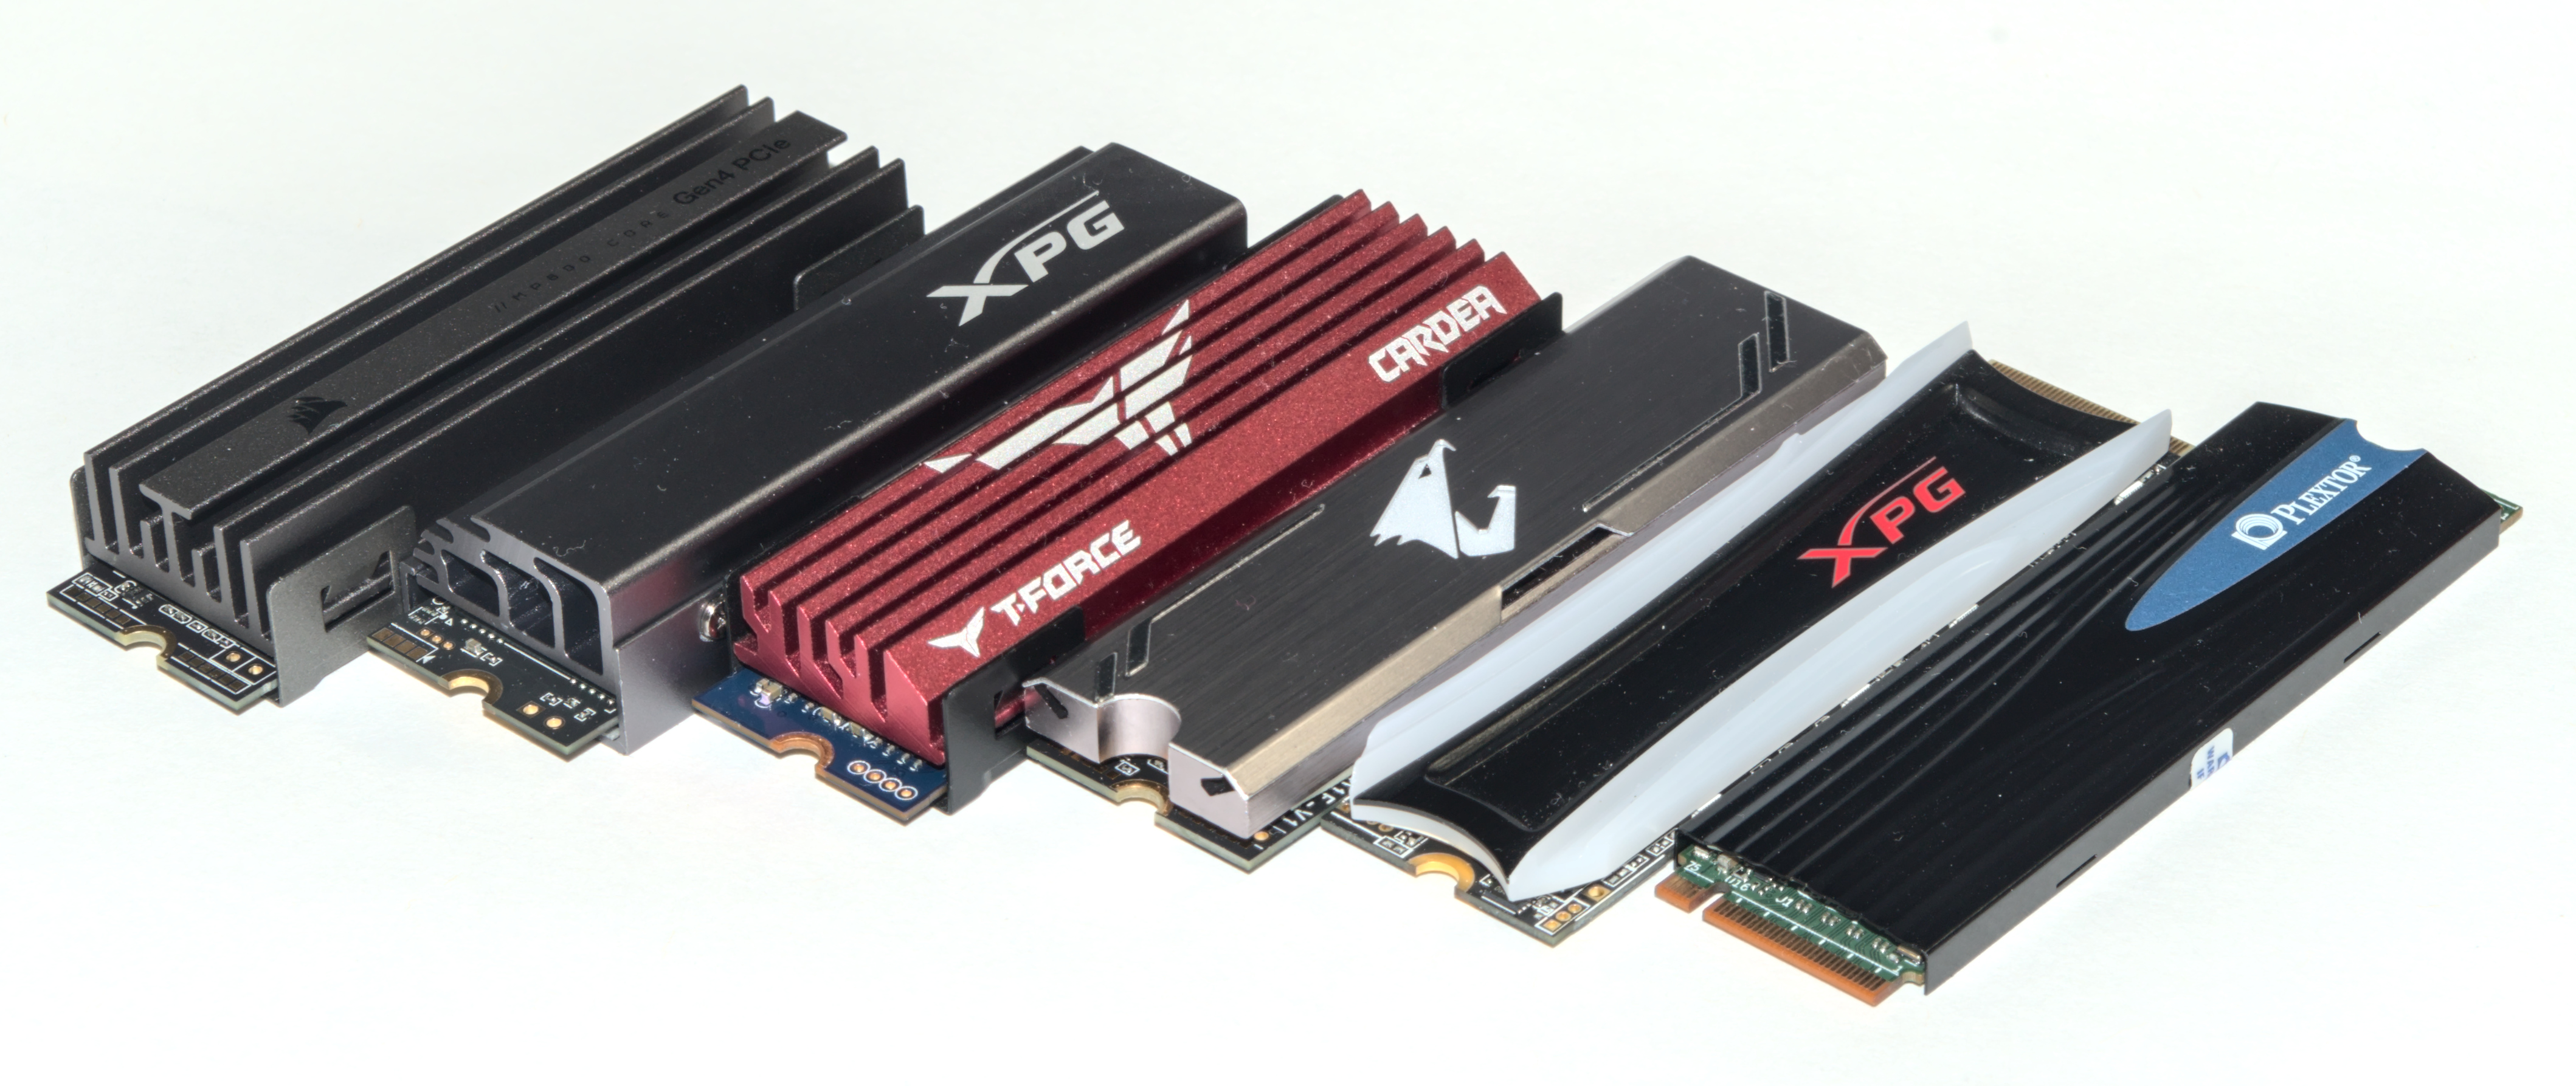
To illustrate our new SSD test suite, we're using 1TB SSDs from a range of market segments. Some of these we have previously reviewed, but since this is a new test suite this is also a fresh look at all of these drives. Starting from the high end:
- Samsung 980 PRO: Samsung's latest NVMe flagship is their first consumer PCIe 4.0 model, and also their first PRO model to use TLC NAND instead of MLC.
- Silicon Power US70: This is one of many drives using the Phison E16 controller and TLC NAND. That combination is what first introduced PCIe 4.0 to the consumer SSD market in 2019, but is now in the process of being replaced by the Phison E18 controller.
- Kingston KC2500: This PCIe 3.0 drive uses the Silicon Motion SM2262EN controller, which is tuned for aggressive SLC caching and usually offers best in class performance at low queue depths.
- SK hynix Gold P31: The benefits of vertical integration are on display as the matched combination of a cutting-edge (albeit still PCIe 3.0) controller and NAND allow this 4-channel drive to perform on par with 8-channel drives while setting records for power efficiency.
- Mushkin Helix-L: This budget-oriented NVMe drive uses TLC NAND and cuts costs with a DRAMless Silicon Motion SM2263XT controller that uses the NVMe Host Memory Buffer feature to borrow up to 64MB of the PC's RAM.
- Corsair MP400: Representing the other main category of budget NVMe drives, the MP400 pairs cheaper, slower QLC NAND with the Phison E12S 8-channel controller, a significant improvement over the 4-channel Silicon Motion SM2263 used by early QLC NVMe drives like the Crucial P1 and Intel 660p/665p. The MP400 has a DRAM cache, but only 512MB rather than the 1GB that would be found on a typical mainstream or high-end drive.
- Samsung 870 EVO: Samsung's brand-new TLC SATA SSD combines their latest generation 3D NAND and controller. We'll be taking a closer look at both the 1TB and 4TB models in a separate review.
- SK hynix Gold S31: Launched in late 2019 with 72-layer TLC, this is a fairly generic mainstream SATA drive with better than average efficiency, slightly slower performance than leading SATA drives, and consistently decent pricing.
- Samsung 870 QVO: This second-generation QLC SATA drive uses the same top-notch controller as the 870 EVO, so its downsides are entirely due to the slower, cheaper QLC NAND flash memory.
A new test suite means we're starting with a clean slate of benchmark results. Updated software and hardware means that even for the tests that are similar to what's in our previous test suite, the new scores are not directly comparable to older scores. Our previous batch of SSD benchmark scores has been archived in the SSD 2018 section of Bench, and a new SSD 2021 section has been started. We'll be continually updating that as new and old drives run through the new test suite in preparation for future reviews.
The test suite itself is also likely to expand a bit more, with application benchmarks and potentially a few more synthetic tests in the works. This article will be updated whenever new benchmarks are added to the test suite, so that this will still be an up to date reference on the how and why of our SSD testing.
In the meantime, we are open to feedback about the new test suite. We're collecting a lot more data from drives than we have in the past, and we'd be happy to receive suggestions for the best way to present that data in reviews. Now that the new test suite has launched, we'll be catching up on reviews of the latest and greatest SSDs while fine-tuning the new review format.
Over the next few pages, we will go over the new tests (and the results).


70 Comments
View All Comments
drmaddogs - Saturday, June 19, 2021 - link
Random is measured by Chaos measures. Turing had it best. And AI mimics this like the human brain.pexxie - Friday, February 12, 2021 - link
I was hoping to hear more from the linux fundi. :-(I guess criticism is easy, guidance takes effort. :-P
pexxie - Saturday, February 13, 2021 - link
An alternative to this might be a retention or volatility test. So basically hook the SSD up in a way that you can quickly yank out its sata or power cable. Then copy a very big file to it, and immediately after Windows says the copy is done; yank out the data or power cable. Then reboot and do a checksum on the file on the target SSD, and compare to the original, and see if any of them have actually written all the data.pexxie - Saturday, February 13, 2021 - link
I wish we could edit posts. Grrr.Otherwise if it's an M.2 slot; hit the reset button on the PC immediately after Windows says the file has finished copying. Then compare checksums.
pexxie - Saturday, February 13, 2021 - link
So basically testing power loss resiliency. There in the 1st world power reliability is of no concern, but it's a big concern here in the 3rd world. Power aint reliable like in America.pexxie - Saturday, February 13, 2021 - link
You can observe the disk's misconduct with the disk LED on your chassis. The disk LED should stop when the file copy is done, but it doesn't - so it still takes time for it to get it onto non-volatile storage. So the data is still floating around in volatile memory while that LED is still on. I have 4 SSDs - for one of them the LED only stays on like a second after the file copy is "done." The others take 5-ish seconds. They all fail in a power cut test - killing power immediately after the OS says the copy is "done." Checked in Windows and Linux. I suspected this was misconduct by Windows, but since I see it in linux too; I'm more confident about it being disk misconduct.pexxie - Saturday, February 13, 2021 - link
My bad. Actually this LED thing was because of buffered writes by the OS. Using xcopy in windows with the /J parameter avoids this "misconduct." So it is actually the OS behaving badly. Now to just figure out how to force all writes to be unbuffered....Even using unbuffered writing; my SSDs still fail my power cut test - parts of the file sit in volatile memory for too long after the copy is "done" and the file gets corrupted on the destination disk.
pexxie - Sunday, February 14, 2021 - link
Woohoo! Finally solved this by mounting partitions in linux using the "sync" option. I knew TLC chips were insanely slow, but damn - less than 1MB/s sequential writing is madness. At least I'm getting 10MB/s sequential with my old MLC chips. So it was the doing of the OS all long. Multiple layers of caching make a tortoise storage medium look like a rabbit.Won't add any more posts/spam. Just wish I could consolidate into 1.
kpb321 - Monday, February 1, 2021 - link
How is the AMD Ryzen 5 3600X system being run without a GPU? That chip doesn't have integrated video so generally I expect it would fail at Post with beep codes. AFAIK none of the AMD APUs have PCI-E 4 support so I don't think there is a way to use integrated video and support PCI-E 4. I mean it doesn't need much of a video card and the 580 in the other system is probably overkill for storage testing but it seems like it would need something even if it's installed in one of the PCI-e 3 lanes hanging off the chipset instead of the 4.0 lane off the cpu.frbeckenbauer - Monday, February 1, 2021 - link
You can run Ryzen headless without issues on many motherboards, while some will indeed refuse to boot. MSI apparently provides a BIOS that has the error disabled so it works headless if you ask them.