A Broadwell Retrospective Review in 2020: Is eDRAM Still Worth It?
by Dr. Ian Cutress on November 2, 2020 11:00 AM ESTTest Setup
As per our processor testing policy, we take a premium category motherboard suitable for the socket, and equip the system with a suitable amount of memory running at the manufacturer's maximum supported frequency. This is also typically run at JEDEC subtimings where possible. It is noted that some users are not keen on this policy, stating that sometimes the maximum supported frequency is quite low, or faster memory is available at a similar price, or that the JEDEC speeds can be prohibitive for performance. While these comments make sense, ultimately very few users apply memory profiles (either XMP or other) as they require interaction with the BIOS, and most users will fall back on JEDEC supported speeds - this includes home users as well as industry who might want to shave off a cent or two from the cost or stay within the margins set by the manufacturer. Where possible, we will extend out testing to include faster memory modules either at the same time as the review or a later date.
| AnandTech | Example Processors |
Motherboard | DRAM | PSU | SSD |
| Intel | |||||
| Haswell | Core i7-4790K | GIGABYTE Z97X-UD5H (F10) |
Geil Veloce 16 GB DDR3-1600 |
Antec HCP 1250W |
Crucial MX500 2 TB |
| Core i7-4790S | |||||
| Broadwell | Core i7-5775C | GIGABYTE Z97X-UD5H (F10) |
Geil Veloce 16 GB DDR3-1600 |
Antec HCP 1250W |
Crucial MX500 2 TB |
| Core i5-5675C | |||||
| Skylake | Core i7-6700K | GIGABYTE X170-Extreme ECC (F21e) |
G.Skill Ripjaws 32 GB DDR4-2133 |
Corsair AX860i |
Crucial MX300 1 TB |
| Core i5-6600K | |||||
| Comet Lake | Core i7-10700 | ASRock Z490 PG Velocita (P1.50) |
Corsair RGB Dominator Pro 32 GB DDR4-2933 |
Corsair AX860i |
Crucial MX500 2 TB |
| Core i5-10600K | |||||
| Tiger Lake | Core i7-1185G7 | Intel Reference |
32 GB LPDDR4X |
Integrated | Samsung PCIe 3.0 |
| AMD | |||||
| Zen+ APU | Ryzen 5 3400G | GIGABYTE X570 Aorus I Pro (F30a) |
ADATA 32 GB DDR4-3200 |
Corsair AX860i |
Crucial MX500 2 TB |
| Athlon 300GE | |||||
| Zen2 APU | Ryzen 5 4650G | GIGABYTE X570 Aorus I Pro (F30a) |
ADATA 32 GB DDR4-3200 |
Corsair AX860i |
Crucial MX500 2 TB |
| Ryzen 3 4350G | |||||
| Zen2 CPU | Ryzen 7 3700X | GIGABYTE X570 Aorus I Pro (F30a) |
ADATA 32 GB DDR3-3200 |
Corsair AX860i |
Crucial MX500 2 TB |
| Ryzen 5 3600 | |||||
Many thanks to...
We must thank the following companies for kindly providing hardware for our multiple test beds. Some of this hardware is not in this test bed specifically, but is used in other testing.
| Hardware Providers for CPU and Motherboard Reviews | |||
| Sapphire RX 460 Nitro |
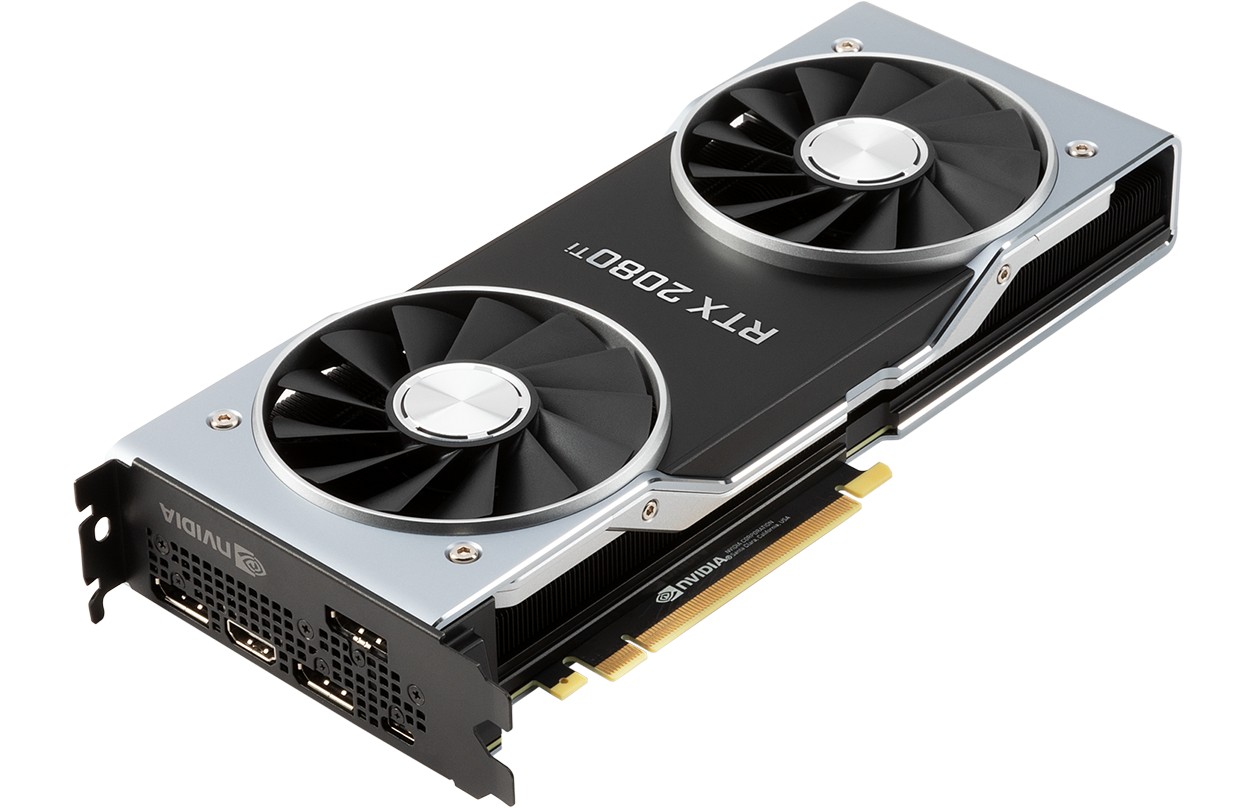
NVIDIA RTX 2080 Ti |
Crucial SSDs | Corsair PSUs |
 |
|
 |
 |
| G.Skill DDR4 | ADATA DDR4 | Silverstone Coolers |
Noctua Coolers |
 |
|
 |
 |
A big thanks to ADATA for the AD4U3200716G22-SGN modules for this review. They're currently the backbone of our AMD testing.
The 2020 #CPUOverload Suite
Our CPU tests go through a number of main areas. We cover Web tests using our un-updateable version of Chromium, opening tricky PDFs, emulation, brain simulation, AI, 2D image to 3D model conversion, rendering (ray tracing, modeling), encoding (compression, AES, video and HEVC), office based tests, and our legacy tests (throwbacks from another generation of code but interesting to compare).
The Win10 Pro operating system is prepared in advance, and we run a number of registry edit commands again to ensure that various system features are turned off and disabled at the start of the benchmark suite. This includes disabling Cortana, disabling the GameDVR functionality, disabling Windows Error Reporting, disabling Windows Defender as much as possible again, disabling updates, and re-implementing power options and removing OneDrive, in-case it sprouted wings again.
A number of these tests have been requested by our readers, and we’ve split our tests into a few more categories than normal as our readers have been requesting specific focal tests for their workloads. A recent run on a Core i5-10600K, just for the CPU tests alone, took around 20 hours to complete.
Power
- Peak Power (y-Cruncher using latest AVX)
- Per-Core Loading Power using POV-Ray
Office
- Agisoft Photoscan 1.3: 2D to 3D Conversion
- Application Loading Time: GIMP 2.10.18 from a fresh install
- Compile Testing (WIP)
Science
- 3D Particle Movement v2.1 (Non-AVX + AVX2/AVX512)
- y-Cruncher 0.78.9506 (Optimized Binary Splitting Compute for mathematical constants)
- NAMD 2.13: Nanoscale Molecular Dynamics on ApoA1 protein
- AI Benchmark 0.1.2 using TensorFlow (unoptimized for Windows)
Simulation
- Digicortex 1.35: Brain stimulation simulation
- Dwarf Fortress 0.44.12: Fantasy world creation and time passage
- Dolphin 5.0: Ray Tracing rendering test for Wii emulator
Rendering
- Blender 2.83 LTS: Popular rendering program, using PartyTug frame render
- Corona 1.3: Ray Tracing Benchmark
- Crysis CPU-Only: Can it run Crysis? What, on just the CPU at 1080p? Sure
- POV-Ray 3.7.1: Another Ray Tracing Test
- V-Ray: Another popular renderer
- CineBench R20: Cinema4D Rendering engine
Encoding
- Handbrake 1.32: Popular Transcoding tool
- 7-Zip: Open source compression software
- AES Encoding: Instruction accelerated encoding
- WinRAR 5.90: Popular compression tool
Legacy
- CineBench R10
- CineBench R11.5
- CineBench R15
- 3DPM v1: Naïve version of 3DPM v2.1 with no acceleration
- X264 HD3.0: Vintage transcoding benchmark
Web
- Kraken 1.1: Depreciated web test with no successor
- Octane 2.0: More comprehensive test (but also deprecated with no successor)
- Speedometer 2: List-based web-test with different frameworks
Synthetic
- GeekBench 4 and GeekBench 5
- AIDA Memory Bandwidth
- Linux OpenSSL Speed (rsa2048 sign/verify, sha256, md5)
- LinX 0.9.5 LINPACK
SPEC (Estimated)
- SPEC2006 rate-1T
- SPEC2017 rate-1T
- SPEC2017 rate-nT
It should be noted that due to the terms of the SPEC license, because our benchmark results are not vetted directly by the SPEC consortium, we have to label them as ‘estimated’. The benchmark is still run and we get results out, but those results have to have the ‘estimated’ label.
Others
- A full x86 instruction throughput/latency analysis
- Core-to-Core Latency
- Cache-to-DRAM Latency
- Frequency Ramping
- A y-cruncher ‘sprint’ to see how 0.78.9506 scales will increasing digit compute
Some of these tests also have AIDA power wrappers around them in order to provide an insight in the way the power is reported through the test.
2020 CPU Gaming (GPU) Benchmarks
In the past, we’ve tackled the GPU benchmark set in several different ways. We’ve had one GPU to multiple games at one resolution, or multiple GPUs take a few games at one resolution, then as the automation progressed into something better, multiple GPUs take a few games at several resolutions. However, based on feedback, having the best GPU we can get hold of over a dozen games at several resolutions seems to be the best bet.
Normally securing GPUs for this testing is difficult, as we need several identical models for concurrent testing, and very rarely is a GPU manufacturer, or one of its OEM partners, happy to hand me 3-4+ of the latest and greatest. In that aspect, over the years, I have to thank ECS for sending us four GTX 580s in 2012, MSI for sending us three GTX 770 Lightnings in 2014, Sapphire for sending us multiple RX 480s and R9 Fury X cards in 2016, and in our last test suite, MSI for sending us three GTX 1080 Gaming cards in 2018.
For our testing on the 2020 suite, we have secured three RTX 2080 Ti GPUs direct from NVIDIA. These GPUs have been optimized for with drivers and in gaming titles, and given how rare our updates are, we are thankful for getting the high-end hardware. (It’s worth noting we won’t be updating to whatever RTX 3080 variant is coming out at some point for a while yet.)
On the topic of resolutions, this is something that has been hit and miss for us in the past. Some users state that they want to see the lowest resolution and lowest fidelity options, because this puts the most strain on the CPU, such as a 480p Ultra Low setting. In the past we have found this unrealistic for all use cases, and even if it does give the best shot for a difference in results, the actual point where you come GPU limited might be at a higher resolution. In our last test suite, we went from the 720p Ultra Low up to 1080p Medium, 1440p High, and 4K Ultra settings. However, our most vocal readers hated it, because even by 1080p medium, we were GPU limited for the most part.
So to that end, the benchmarks this time round attempt to follow the basic pattern where possible:
- Lowest Resolution with lowest scaling, Lowest Settings
- 2560x1440 with the lowest settings (1080p where not possible)
- 3840x2160 with the lowest settings
- 1920x1080 at the maximum settings
Point (1) should give the ultimate CPU limited scenario. We should see that lift as we move up through (2) 1440p and (3) 4K, with 4K low still being quite strenuous in some titles.
Point (4) is essentially our ‘real world’ test. The RTX 2080 Ti is overkill for 1080p Maximum, and we’ll see that most modern CPUs pull well over 60 FPS average in this scenario.
What will be interesting is that for some titles, 4K Low is more compute heavy than 1080p Maximum, and for other titles that relationship is reversed.
For integrated graphics testing, we use the (1) and (4) settings to see where the GPU lies with respect to CPU performance (1) as well as test to confirm just how close integrated graphics is to proper 1080p gaming (4).
So we have the following benchmarks as part of our script, automated to the point of a one-button run and out pops the results approximately 10 hours later, per GPU. Also listed are the resolutions and settings used.
Offline Games
- Chernobylite, 360p Low, 1440p Low, 4K Low, 1080p Max
- Civilization 6, 480p Low, 1440p Low, 4K Low, 1080p Max
- Deus Ex: Mankind Divided, 600p Low, 1440p Low, 4K Low, 1080p Max
- Final Fantasy XIV: 768p Min, 1440p Min, 4K Min, 1080p Max
- Final Fantasy XV: 720p Standard, 1080p Standard, 4K Standard, 8K Standard
- World of Tanks: 768p Min, 1080p Standard, 1080p Max, 4K Max
Online Games
- Borderlands 3, 360p VLow, 1440p VLow, 4K VLow, 1080p Badass
- F1 2019, 768p ULow, 1440p ULow, 4K ULow, 1080p Ultra
- Far Cry 5, 720p Low, 1440p Low, 4K Low, 1080p Ultra
- Gears Tactics, 720p Low, 4K Low, 8K Low 1080p Ultra
- Grand Theft Auto 5, 720p Low, 1440p Low, 4K Low, 1080p Max
- Red Dead Redemption 2, 384p Min, 1440p Min, 8K Min, 1080p Max
- Strange Brigade DX12, 720p Low, 1440p Low, 4K Low, 1080p Ultra
- Strange Brigade Vulkan, 720p Low, 1440p Low, 4K Low, 1080p Ultra
For each of the games in our testing, we take the frame times where we can (the two that we cannot are Chernobylite and FFXIV). For these games, at each resolution/setting combination, we run them for as many loops in a given time limit (often 10 minutes per resolution). Results are then taken as average frame rates and 95th percentiles.
If there are any game developers out there involved with any of the benchmarks above, please get in touch at ian@anandtech.com. I have a list of requests to make benchmarking your title easier! I have a literal document I’ve compiled showing what would be ideal, best practices, who gets it correct and who gets it wrong, etc.
The other angle is DRM, and some titles have limits of 5 systems per day. This may limit our testing in some cases; in other cases it is solvable.


120 Comments
View All Comments
dsplover - Tuesday, November 3, 2020 - link
For Digital s Audio applications the i7-5775C @ 3.3GHz was incredible when disabling the Iris GFX turning the cache over to audio, then running s discrete GFX card.Bested my i7 4790k’s.
Tried OC’ing but even with the kick but Supermicro H70 it was unstable as the Ring Bus/L4 would also clock up and choked @ 2050MHz.
This rig allowed really tight low latency timings and I prayed they would release future designs with a larger cache.
AMD beat them to to it w/Matisse which was good for 8 core only.
The new 5000s are going to be Digital Audio dreams @ low wattage.
Intel just keeps lagging behind.
ironicom - Tuesday, November 3, 2020 - link
fps is irrelevant in civ; turn time and load time are what matter.vorsgren - Tuesday, November 3, 2020 - link
Thanks for using my benchmark! Hope it was usefull!Nictron - Wednesday, November 4, 2020 - link
Which benchmark was that?erotomania - Wednesday, November 4, 2020 - link
Google the username.vorsgren - Wednesday, November 4, 2020 - link
http://www.bay12forums.com/smf/index.php?topic=173...Oxford Guy - Thursday, November 5, 2020 - link
"The Intel skew on this site is getting silly its becoming an Intel promo machine!"Yes. An article that exposes how much Intel was able to get away with sandbagging because of our tech world's lack of adequate competition (seen in MANY tech areas to the point where it's more the norm than the exception) — clearly such an article is showing Intel in a good light.
If you were an Intel shareholder.
For everyone else (the majority of the readers), the article condemns Intel for intentionally hobbing Skylake's gaming performance. ArsTechnica produced an article about this five years ago when it became clear that Skylake wasn't going to have EDRAM.
The ridiculousness of the situation (how Intel got away with charging premium prices for horribly hobbled parts — $10 worth of EDRAM missing, no less) really shows the world's economic system particularly poorly. For all the alleged capitalism in tech, there certainly isn't much competition. That's why Intel didn't have to ship Skylake with EDRAM. Monopolization (and near-monopoly) enables companies to do what they want to do more than anything else: sell less for more. As long as regulators are toothless and/or incompetent the situation won't improve much.
erikvanvelzen - Saturday, November 7, 2020 - link
Ever since the Pentium 4 Extreme Edition I've wondered why intel does not permanently offer a top product with a large L3 or L4 cache.abufrejoval - Monday, November 9, 2020 - link
Just picked up a NUC8i7BEH last week (quad i7, 48EU GT3e with 128MB eDRAM), because they dropped below €300 including VAT: A pretty incredible value at that price point and extremely compatible with just about any software you can throw at it.Yes, Tiger Lake NUC11 would be better on paper and I have tried getting a Ryzen 7-4800U (as PN50-BBR748MD), but I've never heard of one actually shipped.
It's my second NUC8i7BEH, I had gotten another a month or two previously, while it was still at €450, but decided to swap that against a hexa-core NUC10i7FNH (24EU no eDRAM) at the same price, before the 14-days zero-cost return period was up. GT3e+quad-core vs. GT2+hexa-core was a tough call to make, but acutally both run really mostly server loads anyway. But at €300/quad vs €450/hexa the GT3e is quite simply for free, when the silicon die area for the GT3e/quad is in all likelyhood much greater than for the GT2/hexa, even without counting the eDRAM.
My Whiskey-lake has 200MHz less top clock than the Comet-lake, but that doesn't show in single core results, where the L4 seems to put Whiskey consistently into a small lead.
GT3e doesn't quite manage to double graphics performance over GT2, but I am not planning to use either for gaming. Both do fairly well at 4k on anything 2D, even Google Map's 3D renders do pretty well.
BTW: While Google Earth Pro's Flight simulator actually gives a fairly accurate representation of the area where I live, it doesn't do great on FPS, even with an Nvidia GPU. By contrast Microsoft latest and greatest is a huge disappointment when it comes to terrain accuracy (buildings are pure fantasy, not related at all to what's actually there), but delivers ok FPS on my RTX2080ti. No, I didn't try FlightSim on the NUCs...
However, the 3D rendering pipeline Google has put into the browser variant of Google Maps, beats the socks off both Google Earth Pro and Microsoft Flight: With Chrome leading over Firefox significantly, the 3D modelled environment is mind-boggling even on the GT2 at 4k resolutions, it's buttery smooth on GT3e. A browser based flight simulator might actually give the best experience overall, quite hard to believe in a way.
It has me appreciate how good even iGPU graphics could be, if code was properly tuned to make do with what's there.
And it exposes just how bad Microsoft Flight is with nothing but Bing map data unterneath: Those €120 were a full waste of money, but I just saved those from buying the second NUC8 later.
mrtunakarya - Wednesday, December 9, 2020 - link
<a href="https://www.mrtunakarya.com/?m=1">Nice<...