Intel NUC10i7FNH Frost Canyon Review: Hexa-Core NUC Delivers a Mixed Bag
by Ganesh T S on March 2, 2020 9:00 AM ESTBAPCo SYSmark 2018
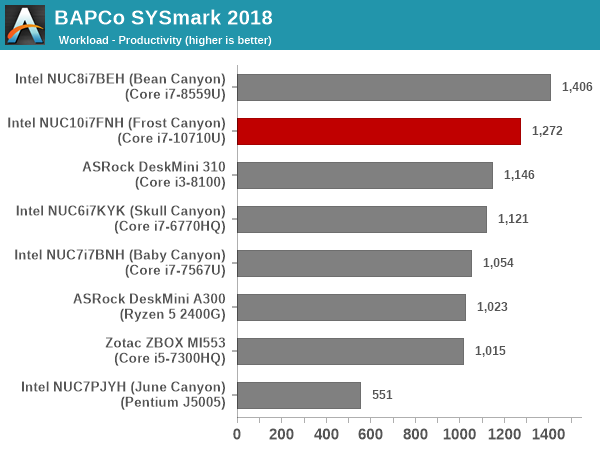
The Intel NUC10i7FNH (Frost Canyon) was evaluated using our Fall 2018 test suite for small-form factor PCs. In the first section, we will be looking at SYSmark 2018.
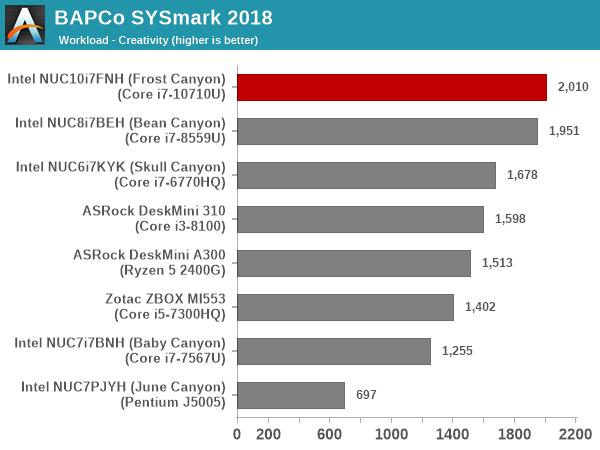
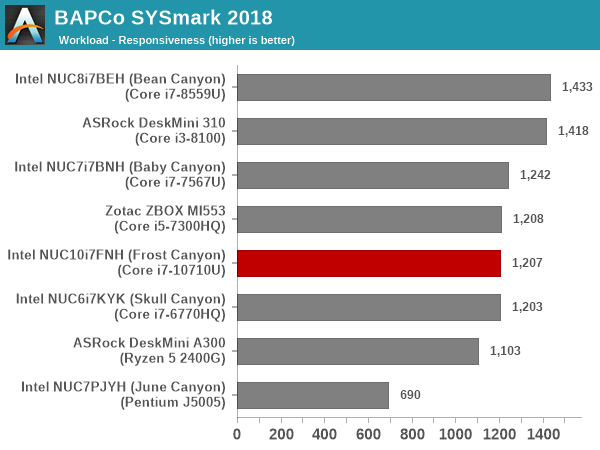
BAPCo's SYSmark 2018 is an application-based benchmark that uses real-world applications to replay usage patterns of business users in the areas of productivity, creativity, and responsiveness. The 'Productivity Scenario' covers office-centric activities including word processing, spreadsheet usage, financial analysis, software development, application installation, file compression, and e-mail management. The 'Creativity Scenario' represents media-centric activities such as digital photo processing, AI and ML for face recognition in photos and videos for the purpose of content creation, etc. The 'Responsiveness Scenario' evaluates the ability of the system to react in a quick manner to user inputs in areas such as application and file launches, web browsing, and multi-tasking.
Scores are meant to be compared against a reference desktop (the SYSmark 2018 calibration system, a Dell Optiplex 5050 tower with a Core i3-7100 and 4GB of DDR4-2133 memory to go with a 128GB M.2 SATA III SSD). The calibration system scores 1000 in each of the scenarios. A score of, say, 2000, would imply that the system under test is twice as fast as the reference system.
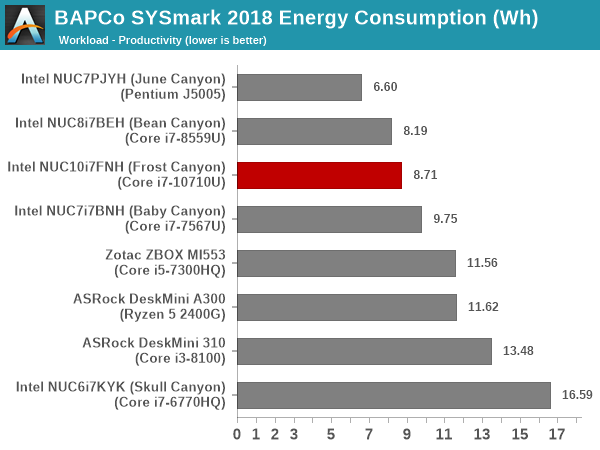
SYSmark 2018 also adds energy measurement to the mix. A high score in the SYSmark benchmarks might be nice to have, but, potential customers also need to determine the balance between power consumption and the efficiency of the system. For example, in the average office scenario, it might not be worth purchasing a noisy and power-hungry PC just because it ends up with a 2000 score in the SYSmark 2014 SE benchmarks. In order to provide a balanced perspective, SYSmark 2018 also allows vendors and decision makers to track the energy consumption during each workload. In the graphs below, we find the total energy consumed by the PC under test for a single iteration of each SYSmark 2018 workload. For reference, the calibration system consumes 5.36 Wh for productivity, 7.71 Wh for creativity, 5.61 Wh for responsiveness, and 18.68 Wh overall.
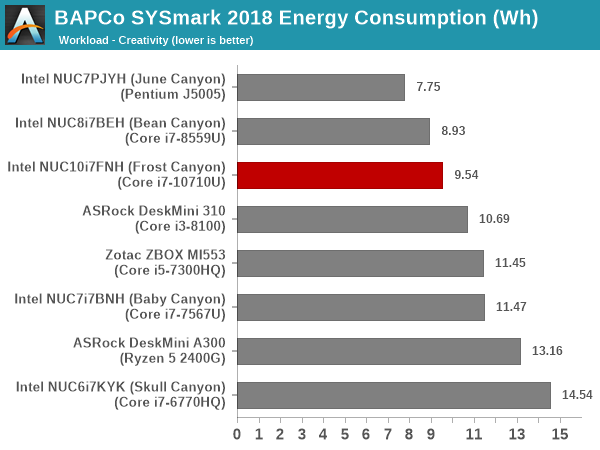
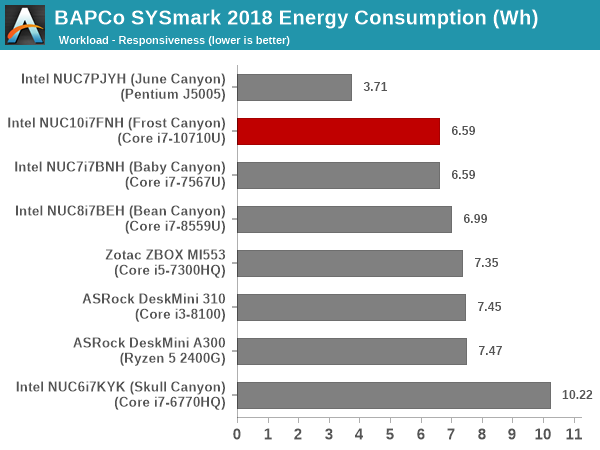
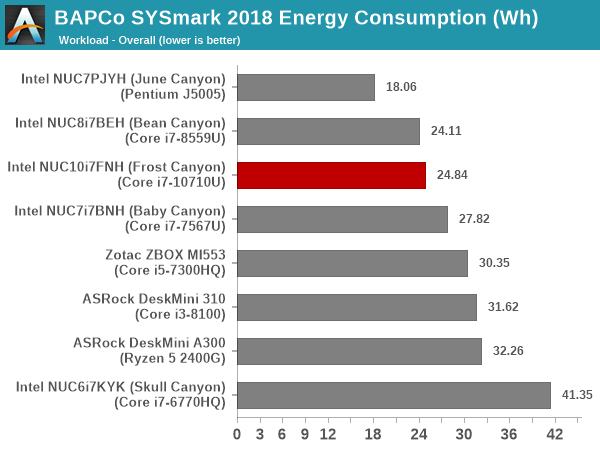
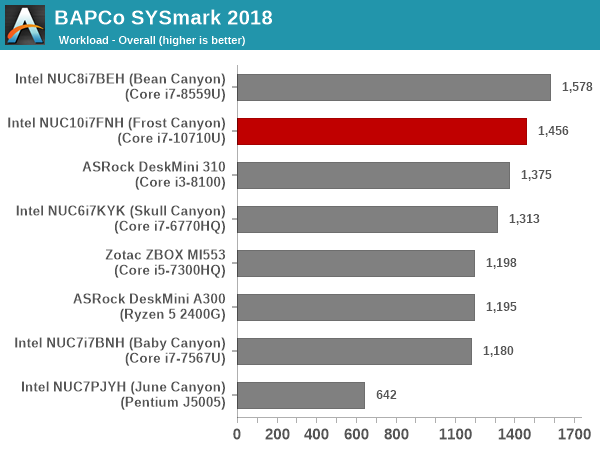
The 'Creativity' workload benefits from the extra cores in Frost Canyon compared to the Core i7-8559U in the Bean Canyon. Our Bean Canyon review configuration is also equipped with a WD Black 3D NVMe SSD (PCIe 3.0 x4) that delivers much better performance compared to the PCIe 3.0 x2 Kingston A1000-class in the Frost Canyon configuration. This results in the responsiveness score for the NUC10i7FNH coming in the middle of the pack compared to the other systems in the sample set. This pulls down the Frost Canyon NUC well below the Bean Canyon NUC in the overall score. The energy consumption is also worse off.


85 Comments
View All Comments
PeachNCream - Monday, March 2, 2020 - link
Ganesh explained why the NUC was opened up in the article. Besides that, NUC systems are built to be user-accessible and are pretty simple to pull apart. It's like 4 screws to get the case open and pulling one ribbon cable off the motherboard to disconnect the mechanical drive. The barebones models are the same hardware and you have to crack the case to add storage or RAM or you do not have a complete computer.nico_mach - Tuesday, March 3, 2020 - link
I don't actually disagree with his reasoning, but I definitely have mixed feelings as a review.I forgot about the Atom NUCs completely. There's a name I haven't heard in a long time.
watzupken - Monday, March 2, 2020 - link
With the new AMD APU arriving this year, I wonder if this is dead in the water considering the higher cost of the NUC. 14nm+++ is not going to save Intel when facing off 7nm from AMD as shown in the current processor stack from both teams.timecop1818 - Monday, March 2, 2020 - link
"7nm".Intel's "14nm+++++" (keep adding pluses, retards) is closer to 10nm than AMD's crap.
Fulljack - Monday, March 2, 2020 - link
while fabrication nomenclature are now nowhere near it's actual marketed size, Intel's 14nm are still nowhere close with their own 10nm, and couldn't compete with TSMC's 7nmQasar - Monday, March 2, 2020 - link
keep posting useless, anti amd, crap. keep showing the rest of us, and demonstrate to the world that you are a nitwit, then we will let you hang yourself, king oft trollsLord of the Bored - Thursday, March 5, 2020 - link
Isn't this copy/paste'd from one of your other shill threads? Come on, man. Intel isn't paying you to repost the same old bullshit, your fans demand new content!Korguz - Thursday, March 5, 2020 - link
timecop1818 cant post new content, cause it doesnt have any.xenol - Monday, March 2, 2020 - link
The NUC product line is sort of dead in the water any way, I'd argue.YB1064 - Monday, March 2, 2020 - link
It would be helpful to include a small table that of benchmarks vs CPU performance scaling. Perhaps this is hard to do, but as a naive simple example:Benchmark#1 - scales with threads/cores
Benchmark#2 - scales with clocks/IPC
This is most likely highly complicated, but if anybody can do it, it is you guys. Ian, care to take a stab?