The Western Digital WD Blue SN500 SSD Review: Moving The Mainstream To NVMe
by Billy Tallis on April 19, 2019 9:30 AM ESTWhole-Drive Fill
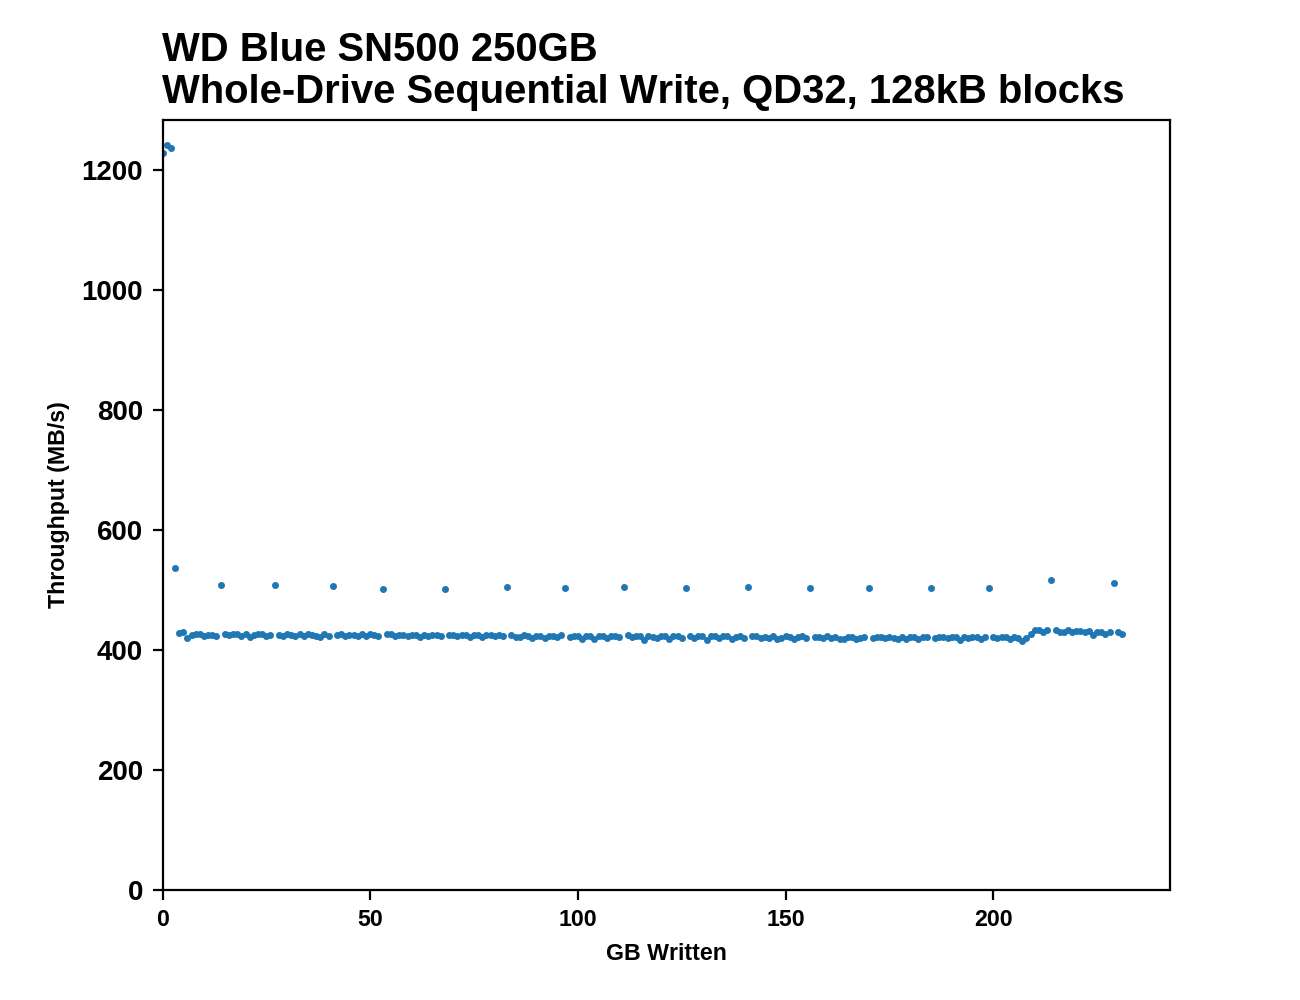
This test starts with a freshly-erased drive and fills it with 128kB sequential writes at queue depth 32, recording the write speed for each 1GB segment. This test is not representative of any ordinary client/consumer usage pattern, but it does allow us to observe transitions in the drive's behavior as it fills up. This can allow us to estimate the size of any SLC write cache, and get a sense for how much performance remains on the rare occasions where real-world usage keeps writing data after filling the cache.
 |
|||||||||
The 250GB WD Blue SN500's SLC write cache lasts for a mere 3GB before the write speed drops down to SATA speeds. After the cache is exhausted, the write speed is very consistent, with periodic short of higher performance that last for less than 1GB.
 |
|||||||||
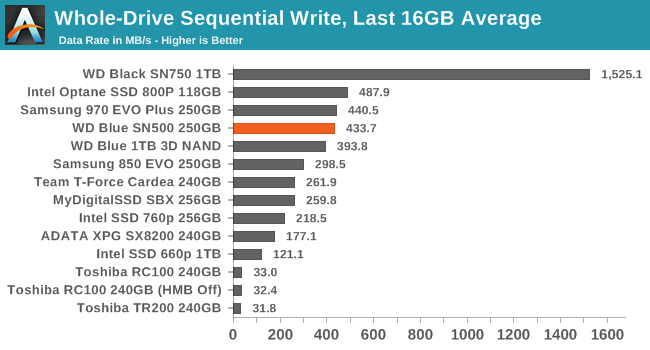
| Average Throughput for last 16 GB | Overall Average Throughput | ||||||||
The SN500's sustained sequential write speed of about 432MB/s doesn't make much use of the speed offered by the PCIe host connection, but it's very good for a drive in this capacity class: the Samsung 970 EVO Plus is barely any faster, though its SLC cache is much larger. None of the other low-end NVMe drives we've tested come close to sustaining the long-term write performance that the SN500 provides.
Working Set Size
Most mainstream SSDs have enough DRAM to store the entire mapping table that translates logical block addresses into physical flash memory addresses. DRAMless drives only have small buffers to cache a portion of this mapping information. When accessing a logical block whose mapping is not cached, the drive needs to read the mapping from the full table stored on the flash memory before it can read the user data stored at that logical block. This adds extra latency to read operations and in the worst case may double random read latency.
We can estimate the size of any on-controller mapping buffer by performing random reads from different sized portions of the drive. When performing random reads from a small slice of the drive, we expect the mappings to all fit in the cache, and when performing random reads from the entire drive, we expect mostly cache misses.
When performing this test on mainstream drives with a full-sized DRAM cache, we expect performance to be generally constant regardless of the working set size, or for performance to drop only slightly as the working set size increases.
 |
|||||||||
The SN500 offers good random read IOPS for working set sizes up to about 4GB before performance begins to decline. Based on the usual ratio of requiring 1MB of mapping data cache per GB of storage, it looks like the SN500's controller devotes around 4MB of SRAM to this purpose. That's significantly smaller than the typical Host Memory Buffer sizes used by DRAMless NVMe SSDs that implement that feature. For example, the Toshiba RC100 uses an HMB of 38MB and maintains random read performance out to at least 24GB working set sizes.
While the SN500's cache of address mapping data may be rather small, it is clearly plenty fast: for small working set sizes, the SN500's random read performance is higher than the WD Black SN750.
BAPCo SYSmark 2018
BAPCo's SYSmark 2018 is an application-based benchmark that uses real-world applications to replay usage patterns of business users, with subscores for productivity, creativity and responsiveness. Scores represnt overall system performance and are calibrated against a reference system that is defined to score 1000 in each of the scenarios. A score of, say, 2000, would imply that the system under test is twice as fast as the reference system.
SYSmark scores are based on total application response time as seen by the user, including not only storage latency but time spent by the processor. This means there's a limit to how much a storage improvement could possibly increase scores, because the SSD is only in use for a small fraction of the total test duration. This is a significant difference from our ATSB tests where only the storage portion of the workload is replicated and disk idle times are cut short to a maximum of 25ms.
| AnandTech SYSmark SSD Testbed | |
| CPU | Intel Core i5-7400 |
| Motherboard | ASUS PRIME Z270-A |
| Chipset | Intel Z270 |
| Memory | 2x 4GB DDR4-2666 CL15 |
| Case | In Win C583 |
| Power Supply | Cooler Master G550M |
| OS | Windows 10 64-bit, version 1803 |
Our SSD testing with SYSmark uses a different test system than the rest of our SSD tests. This machine is set up to measure total system power consumption rather than just the drive's power.
 |
|||||||||
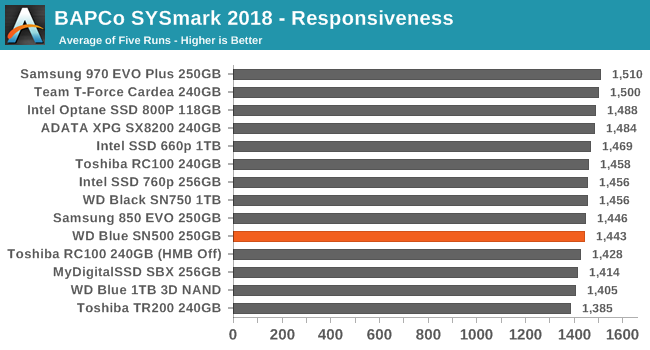
| Creativity | Productivity | Responsiveness | Overall | ||||||
Only the Responsiveness subscore shows a meaningful difference between SSDs of similar capacities, and even then the difference between the top NVMe drives and the slowest DRAMless SATA drives is fairly small. The WD Blue SN500's Responsiveness score is a bit slower than average for this bunch of SSDs, but as more of an entry-level NVMe drive this isn't a disappointment for the SN500.
Energy Usage
The SYSmark energy usage scores measure total system power consumption, excluding the display. Our SYSmark test system idles at around 26 W and peaks at over 60 W measured at the wall during the benchmark run. SATA SSDs seldom exceed 5 W and idle at a fraction of a watt, and the SSDs spend most of the test idle. This means the energy usage scores will inevitably be very close. A typical notebook system will tend to be better optimized for power efficiency than this desktop system, so the SSD would account for a much larger portion of the total and the score difference between SSDs would be more noticeable.
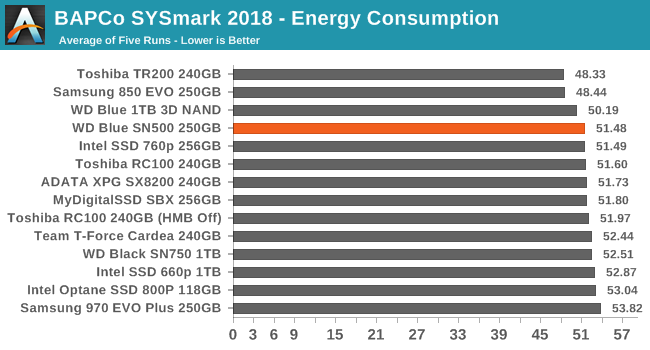
The WD Blue SN500 is one of the most efficient NVMe drives in its capacity class, but the SATA drives still take all the top scores for energy consumption over the course of a SYSmark run. There are several faster NVMe drives that have power requirements only slightly above the SN500 despite including the DRAM cache the SN500 lacks.


50 Comments
View All Comments
DyneCorp - Sunday, April 21, 2019 - link
You got the EX920 512GB on sale. That's not the typical retail price, and the SN500 is already sitting at $65 retail.You understand the price of this drive will go down? As they always do after initial release? And when the prices of NAND skyrocket again, the SN500 will have a major advantage?
For the majority of consumers, the SN500 is a viable option.
airider - Friday, April 19, 2019 - link
This is WD clearing out their inventory while making way for the higher capacity/performance versions coming out shortly. Don't expect to see this product anymore by the end of 2019.flyingpants265 - Saturday, April 20, 2019 - link
Wait, so it's not QLC nand? That's great. It states 300TB write endurance, compared to the 100TB of the 500gb Crucial P1, for the same price. Goodbye, QLC! For now..DyneCorp - Sunday, April 21, 2019 - link
For consumers, the endurance rating matters none. You'll never chew through 100TB of endurance, especially under consumer workloads. The massive SLC cache buffers utilized in the P1 and 660p in addition to smart caching algorithms increase endurance substantially. Also, the DRAM buffer in addition to smart controller firmware effectively mitigate write amplification by several factors. You'll never chew through the endurance of the P1 or the 660p, period.Endurance ratings are meaningless under consumer workloads. SSDs far outlast their given endurance ratings.
flyingpants265 - Wednesday, April 24, 2019 - link
Well, hopefully. Because just to download install one game (hitman 2) requires about 240GB of writes. If I do that 3 times, that's 1% of my drive's life gone.flyingpants265 - Wednesday, April 24, 2019 - link
Uh, 4 times.DyneCorp - Wednesday, April 24, 2019 - link
This is incorrect. 240GB of writes does not equal 240GB of endurance lost, especially if they are sequential writes because:1.) The controller can reduce write amplification by intelligently shifting data around
2.) Sequential writes to the SLC cache increase endurance significantly
3.) Folding blocks from the pSLC cache to QLC actually increases endurance
DyneCorp - Wednesday, April 24, 2019 - link
By the way, this is evidenced by the ADATA SU800. It has a massive dynamic SLC cache buffer and older Micron 32-layer 384-Gbit NAND and still carries the highest endurance rating on the market.willis936 - Saturday, April 20, 2019 - link
I'm surprised there isn't a significant difference in idle power consumption or drive-side efficiency for a DRAMless NVMe drive. This is a pretty nice piece of hardware, regardless of price.DyneCorp - Saturday, April 20, 2019 - link
Thanks for the review, Billy! I really appreciate your work; you always do an excellent job and I appreciate you taking time out of your life to throw these reviews up.Without the DRAM buffer, how do you think write amplification is affected? Obviously endurance is actually quite high (in SU800 territory) and performance is quite high. This is especially interesting considering how small the SLC cache buffer is.
Do you think WD has effectively mitigated negative endurance impact through firmware?