ASRock Beebox-S 7200U Kaby Lake UCFF PC Review
by Ganesh T S on February 7, 2017 8:00 AM ESTPerformance Metrics - I
The ASRock Beebox-S 7200U was evaluated using our standard test suite for low power desktops / industrial PCs. Not all benchmarks were processed on all the machines due to updates in our testing procedures. Therefore, the list of PCs in each graph might not be the same. In the first section, we will be looking at SYSmark 2014 SE, as well as some of the Futuremark benchmarks.
BAPCo SYSmark 2014 SE
BAPCo's SYSmark 2014 SE is an application-based benchmark that uses real-world applications to replay usage patterns of business users in the areas of office productivity, media creation and data/financial analysis. In addition, it also addresses the responsiveness aspect which deals with user experience as related to application and file launches, multi-tasking etc. Scores are meant to be compared against a reference desktop (the SYSmark 2014 SE calibration system in the graphs below). While the SYSmark 2014 benchmark used a Haswell-based desktop configuration, the SYSmark 2014 SE makes the move to a Lenovo ThinkCenter M800 (Intel Core i3-6100, 4GB RAM and a 256GB SATA SSD). The calibration system scores 1000 in each of the scenarios. A score of, say, 2000, would imply that the system under test is twice as fast as the reference system.
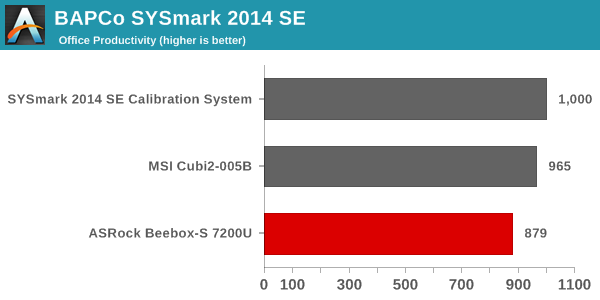
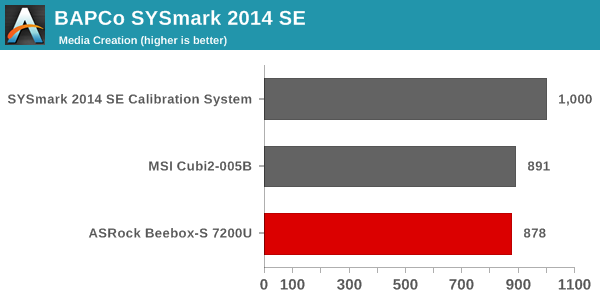
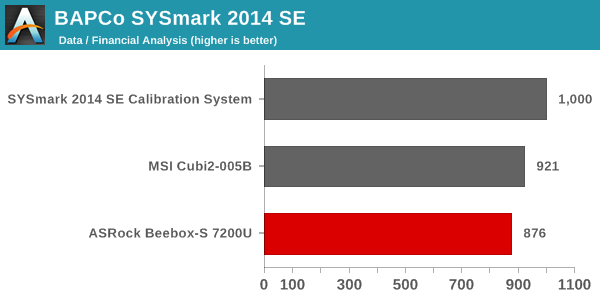
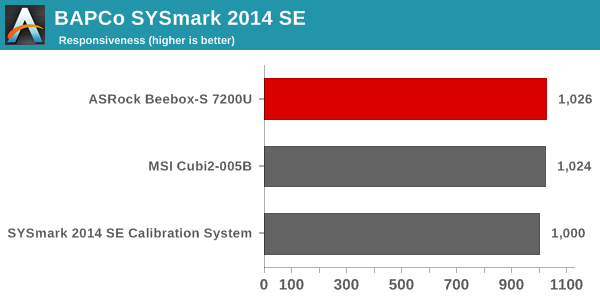
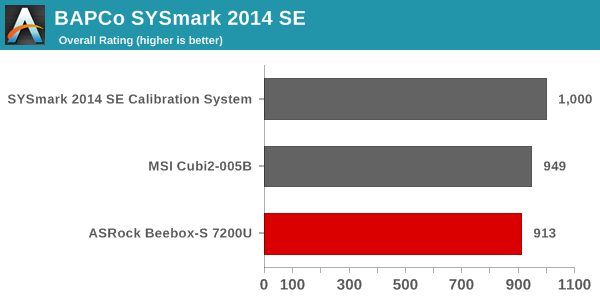
The scores tend to align with the capabilities of the CPU in the systems. The Core i5-7200U in the Beebox-S slightly lags the Core i7-7500U in the Cubi 2 in terms of both cache size and clock frequency. Obviously, neither of them can match the capabilities of the desktop-class CPU with higher TDP in the calibration system. The only scenario where the Beebox-S scores is responsiveness - likely due to the use of a NVMe SSD compared to the SATA SSD used in the Cubi 2.
SYSmark 2014 SE also adds energy measurement to the mix. A high score in the SYSmark benchmarks might be nice to have, but, potential customers also need to determine the balance between power consumption and the efficiency of the system. For example, in the average office scenario, it might not be worth purchasing a noisy and power-hungry PC just because it ends up with a 2000 score in the SYSmark 2014 SE benchmarks. In order to provide a balanced perspective, SYSmark 2014 SE also allows vendors and decision makers to track the energy consumption during each workload. In the graphs below, we find the total energy consumed by the PC under test for a single iteration of each SYSmark 2014 SE workload and how it compares against the calibration systems.
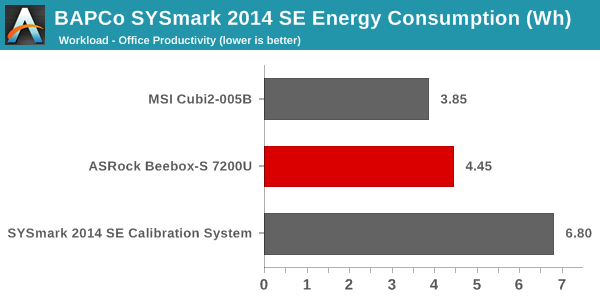
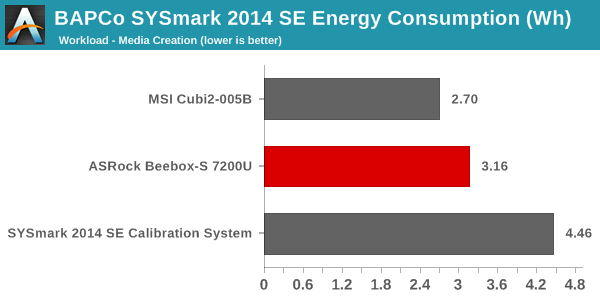
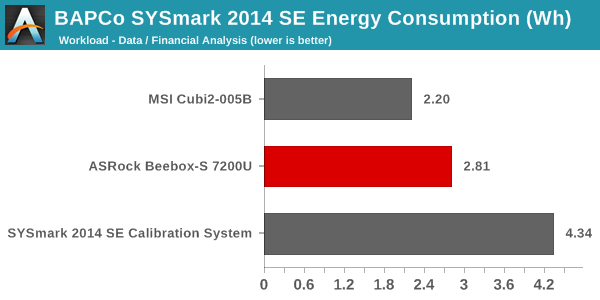

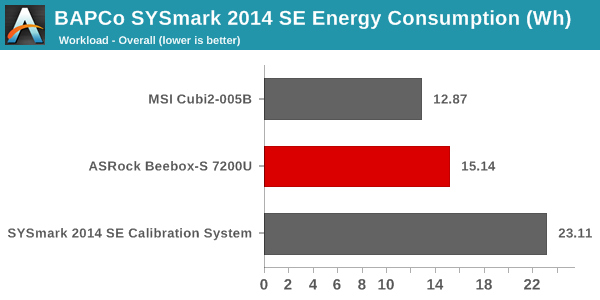
The comparative energy consumption numbers for each scenario are as expected. The Beebox-S is slightly more energy-intensive (despite the use of a CPU with the same TDP as the Cubi 2) likely due to the more power-hungry NVMe SSD in the assembled configuration.
Futuremark PCMark 8
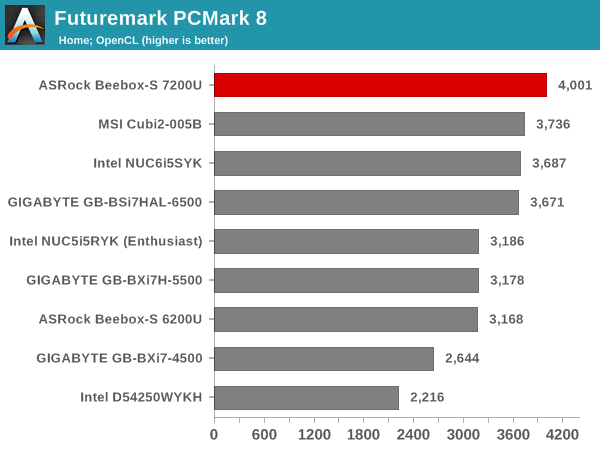
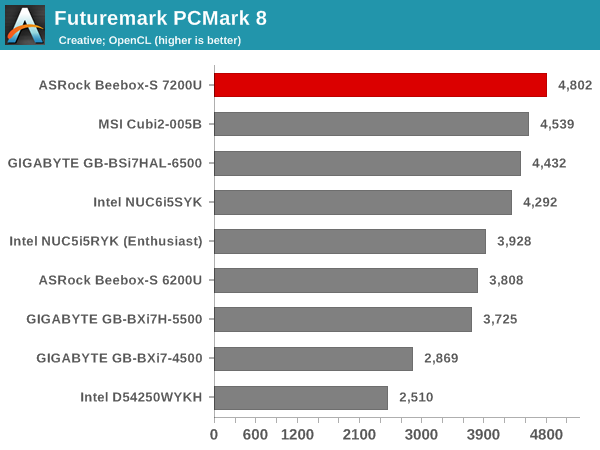
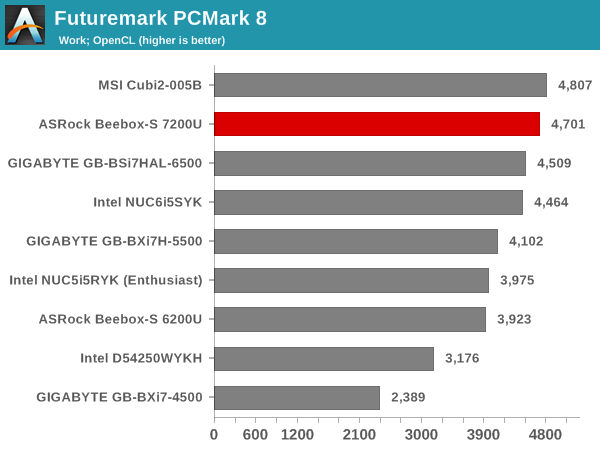
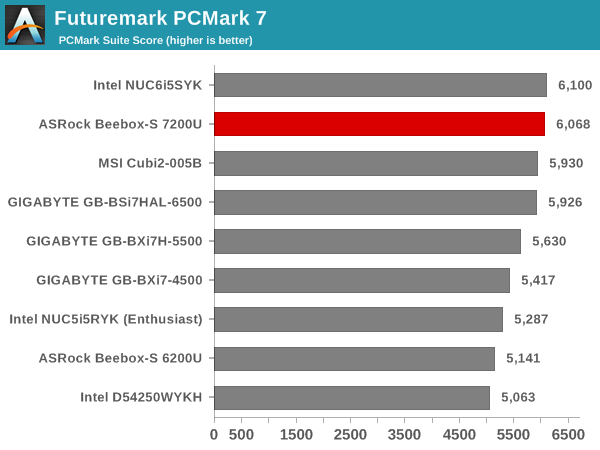
PCMark 8 provides various usage scenarios (home, creative and work) and offers ways to benchmark both baseline (CPU-only) as well as OpenCL accelerated (CPU + GPU) performance. We benchmarked select PCs for the OpenCL accelerated performance in all three usage scenarios. These scores are heavily influenced by the CPU in the system. The storage system also plays a significant role - which is why we see the Beebox-S 7200U and the MSI Cubi 2 trade positions in the top two spots depending on the benchmark. Interestingly, for these workloads, the 15W TDP Core i5-7200U is enough to go past the Skylake and Broadwell BRIX units that configure the CPU for a 28W TDP.
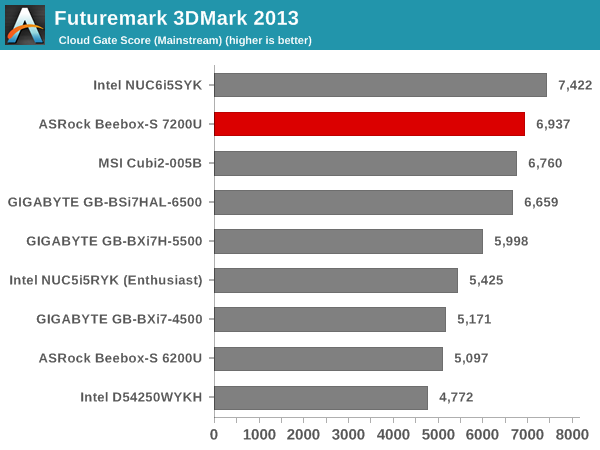
Miscellaneous Futuremark Benchmarks
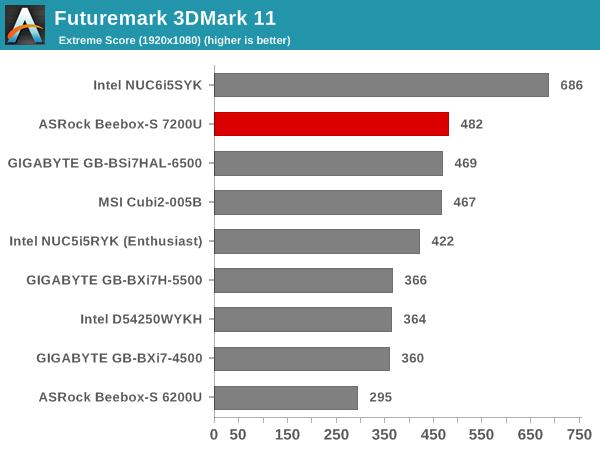
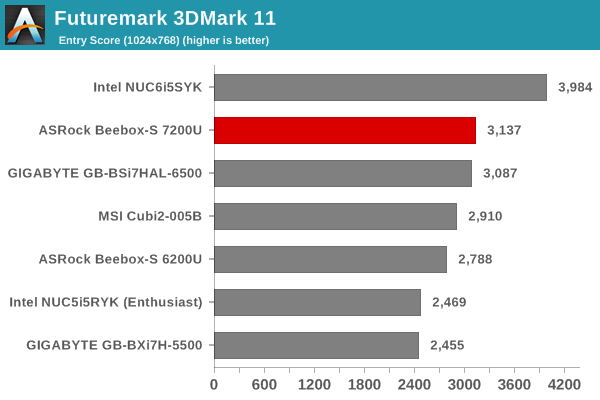
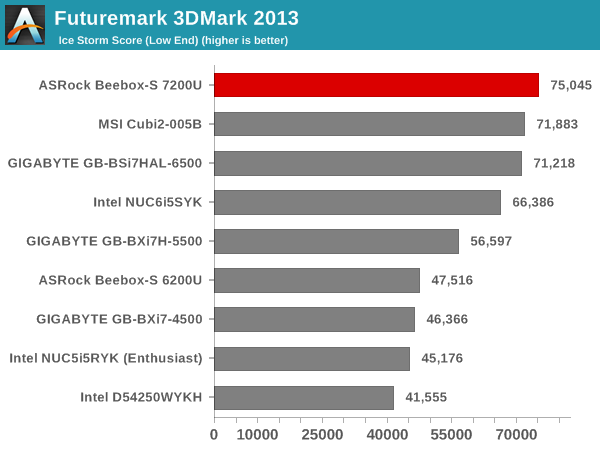
The GPU-focused benchmarks perform similarly for both the Beebox-S 7200U and the Cubi 2. However, the Skylake Intel NUC with Iris Graphics manages to comfortably outscore the Intel HD Graphics 620 in the Beebox-S 7200U.
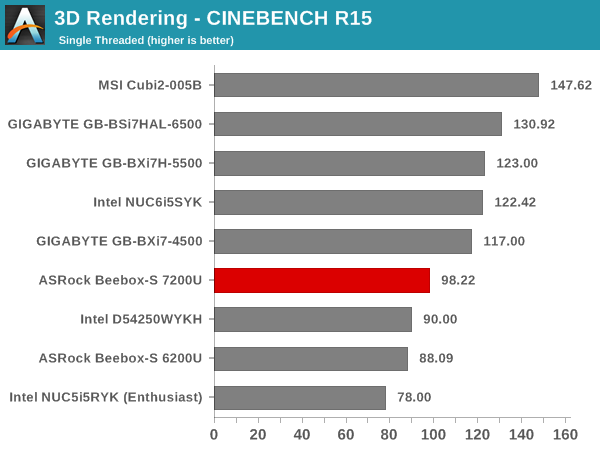
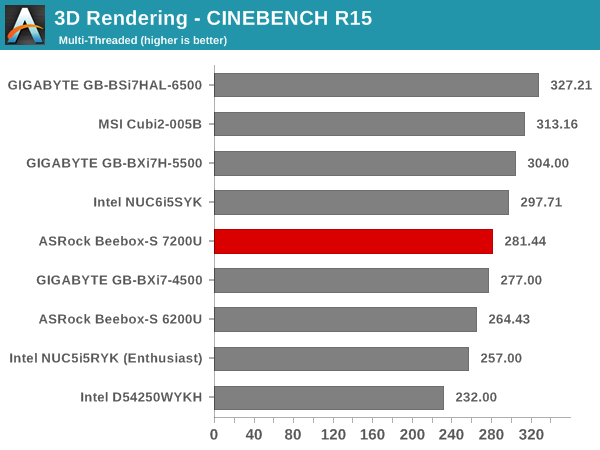
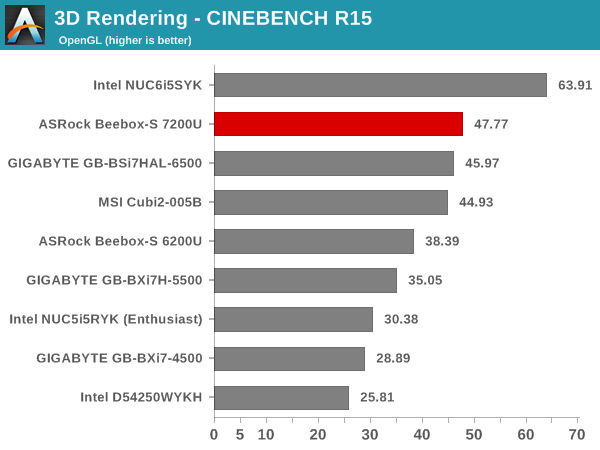
3D Rendering - CINEBENCH R15
We have moved on from R11.5 to R15 for 3D rendering evaluation. CINEBENCH R15 provides three benchmark modes - OpenGL, single threaded and multi-threaded. Evaluation of select PCs in all three modes provided us the following results. The OpenGL version numbers stack up similar to the Futuremark GPU benchmarks. The CPU versions are in line with expectations for a Core i5 U-series CPU.


33 Comments
View All Comments
fanofanand - Thursday, February 9, 2017 - link
Your logic is sound, but most failures don't occur within the warranty period. Sometimes it seems they set the warranty period based on failure rates during QA testing. If they have a 50% failure rate on year 4 they just make sure the warranty is 3 years (oversimplified and inaccurate figures but that's the gist of it). Auto manufacturers have been doing this for decades, there was a reason most powertrain warranties went to 50,000 miles but massive head gasket failures or transmission failures would occur at 60k (I experienced both with GM products which is why they won't be getting any more of my hard earned money).OzzyLogic - Monday, February 20, 2017 - link
It's like you took the words out of my mouth, i really dislike fanned systems because of the dust build up that you will eventually get. No matter what you do, dust will always find its way into your system somehow. Also one of the reasons why i bought my self one of these. https://www.logicsupply.com/eu-en/ml100g-50/thesloth - Tuesday, February 7, 2017 - link
I probably just need to RTFA properly, but I don't see any graphics or mention of noise (dB). For a HTPC I would have thought that relevant.Sene - Tuesday, February 7, 2017 - link
Why don't you test the GPU with MadVR. Even if it has limited power it would be interesting to know the best settings it can supportDavid_K - Tuesday, February 7, 2017 - link
From my testing with a 7700K and its build in HD 630, madVR is just too heavy for the gpu, on 4K videos it becomes a stutterfest.Samus - Wednesday, February 8, 2017 - link
Same experience on my i5-7600k with HD630...only reason I bothered trying was because my 1070 took a week longer to arrive than the rest of the parts. I wasn't optimistic going in but figured I'd see what Intel GPU's can do since I haven't really toyed with one since my 4th gen Haswell laptop.TheinsanegamerN - Wednesday, February 8, 2017 - link
I'm still incredibly dissapointed in intel's lack of improvements in the iGPU race. HD 630 is onyl, on average, 2FPS faster in games then the hd 4600 from haswell.three years and a whole 2FPS, mostly thanks to a better memory controller. Why cant intel start offering more chips with iris graphics?
Raven ridge cant get here soon enough.
BrokenCrayons - Wednesday, February 8, 2017 - link
I haven't really looked into iGPU performance improvements at all since Ivy Bridge's HD 4000. Is that really all we've gained in the past few years out of non-Iris Intel graphics? They've got to be hitting some kind of shared system memory bottleneck that makes it a difficult prospect to wring more out of their iGPUs. Though that doesn't explain the A-series GPUs being fairly quick despite lacking any sort of additional memory bandwidth.nathanddrews - Wednesday, February 8, 2017 - link
There's not much to look into unless you play mostly older games. People are creative and I've seen playable frame rates on non-Iris IGP newer games, but it usually involves 720p resolution and minimal settings or INI hacks to disable engine features. Even the most powerful Intel IGP (Iris Pro) chokes on games like Doom (2016) and Tomb Raider (latest). Context is everything.https://youtu.be/LV8Msa-Pxl8
BrokenCrayons - Thursday, February 9, 2017 - link
Thanks for the response. I'd gotten a vague sense that Intel wasn't really leaping ahead with iGPU performance by the fact that the company's announcements stressed additional features as opposed to "x-times more performance" or "y-percent faster than last gen graphics" but I didn't realize things have gotten so stagnant recently. The fact that Iris exists sort of glosses over and distracts from the much more common eDRAM-less iGPU performance.*rant disclaimer* Iris has really done a lot of damage to the GPU market in general. By raising the bar of iGPU performance to the point where lower end discrete cards are rivaled by Iris parts, Intel's effectively eliminated the low end discrete GPU segment altoghether. At the same time, Iris is an uncommon thing so while the performance exists, it's not available for purchase and there aren't GPUs available to fill the gap between the iGPUs you can actually buy and the bottom end of the current discrete GPU product stack. Thanks for that crap Intel. Thanks a lot for sticking us with the choice of a 75W TDP discrete card or an anemic iGPU that hasn't gotten faster in years.